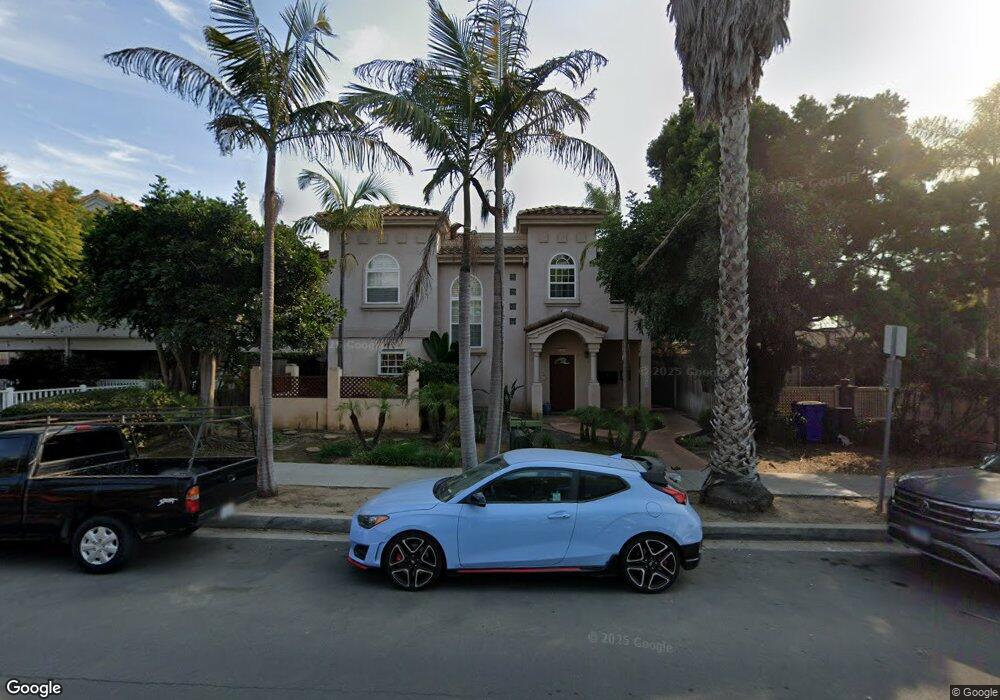
1415 Thomas Ave Unit LU3 San Diego, CA 92109
Pacific Beach NeighborhoodEstimated Value: $1,212,735 - $1,372,000
3
Beds
3
Baths
1,556
Sq Ft
$813/Sq Ft
Est. Value
About This Home
This home is located at 1415 Thomas Ave Unit LU3, San Diego, CA 92109 and is currently estimated at $1,264,434, approximately $812 per square foot. 1415 Thomas Ave Unit LU3 is a home located in San Diego County with nearby schools including Crown Point Junior Music Academy, Pacific Beach Middle, and Mission Bay High School.
Ownership History
Date
Name
Owned For
Owner Type
Purchase Details
Closed on
Jun 21, 2013
Sold by
Eaves Chad and Eaves Amy
Bought by
Malkasian Arsen and Malkasian Gina D
Current Estimated Value
Home Financials for this Owner
Home Financials are based on the most recent Mortgage that was taken out on this home.
Original Mortgage
$434,000
Interest Rate
4%
Mortgage Type
Adjustable Rate Mortgage/ARM
Purchase Details
Closed on
Apr 19, 2007
Sold by
Russell David R and Russell Alessandra V
Bought by
Eaves Chad and Eaves Amy
Home Financials for this Owner
Home Financials are based on the most recent Mortgage that was taken out on this home.
Original Mortgage
$556,000
Interest Rate
6.5%
Mortgage Type
Purchase Money Mortgage
Purchase Details
Closed on
Jun 4, 2003
Sold by
Turk Michael E
Bought by
Russell David R and Russell Alessandra
Home Financials for this Owner
Home Financials are based on the most recent Mortgage that was taken out on this home.
Original Mortgage
$375,000
Interest Rate
5.53%
Mortgage Type
Purchase Money Mortgage
Create a Home Valuation Report for This Property
The Home Valuation Report is an in-depth analysis detailing your home's value as well as a comparison with similar homes in the area
Home Values in the Area
Average Home Value in this Area
Purchase History
| Date | Buyer | Sale Price | Title Company |
|---|---|---|---|
| Malkasian Arsen | $668,000 | Fidelity National Title Co | |
| Eaves Chad | $695,000 | Fidelity National Title Co | |
| Russell David R | $525,000 | Chicago Title |
Source: Public Records
Mortgage History
| Date | Status | Borrower | Loan Amount |
|---|---|---|---|
| Previous Owner | Malkasian Arsen | $434,000 | |
| Previous Owner | Eaves Chad | $556,000 | |
| Previous Owner | Russell David R | $375,000 |
Source: Public Records
Tax History Compared to Growth
Tax History
| Year | Tax Paid | Tax Assessment Tax Assessment Total Assessment is a certain percentage of the fair market value that is determined by local assessors to be the total taxable value of land and additions on the property. | Land | Improvement |
|---|---|---|---|---|
| 2025 | $9,891 | $818,867 | $583,111 | $235,756 |
| 2024 | $9,891 | $802,812 | $571,678 | $231,134 |
| 2023 | $9,673 | $787,071 | $560,469 | $226,602 |
| 2022 | $9,416 | $771,639 | $549,480 | $222,159 |
| 2021 | $9,352 | $756,509 | $538,706 | $217,803 |
| 2020 | $9,239 | $748,753 | $533,183 | $215,570 |
| 2019 | $9,074 | $734,073 | $522,729 | $211,344 |
| 2018 | $8,483 | $719,680 | $512,480 | $207,200 |
| 2017 | $8,282 | $705,570 | $502,432 | $203,138 |
| 2016 | $8,151 | $691,736 | $492,581 | $199,155 |
| 2015 | $8,031 | $681,346 | $485,182 | $196,164 |
| 2014 | $7,904 | $668,000 | $475,678 | $192,322 |
Source: Public Records
Map
Nearby Homes
- 1341 Thomas Ave
- 4135 Fanuel St
- 4071 Riviera Dr
- 4073 Riviera Dr
- 4037 Haines St
- 1361 Felspar St Unit 7
- 1152-54 Pacific Beach Dr
- 4053-55 Jewell St
- 3920 Riviera Dr Unit A
- 1270 Emerald St
- 1220 Emerald St
- 1300 Grand Ave Unit 38, 39
- 4733 Ingraham St
- 3843 Riviera Dr Unit 1
- 3850 Riviera Dr Unit 3B
- 1885 Diamond St Unit 2-235
- 1885 Diamond St Unit 329
- 1885 Diamond St Unit 2-234
- 1855 Diamond St Unit 5-309
- 1775 Diamond St Unit 220
- 1413 Thomas Ave Unit LU2
- 1411 Thomas Ave
- 1417 Thomas Ave Unit LU4
- 1421 Thomas Ave Unit 2
- 1421 Thomas Ave Unit 1
- 1421 Thomas Ave Unit 4
- 1421 Thomas Ave Unit 3
- 1403 Thomas Ave
- 4277 Gresham St
- 1433 Thomas Ave
- 4265 Gresham St
- 1420 Reed Ave
- 1428 Reed Ave Unit 32
- 1414 Thomas Ave
- 1414 Reed Ave
- 1424 Thomas Ave
- 1434 Reed Ave
- 1404 Thomas Ave
- 1449 Thomas Ave
- 1445 Thomas Ave