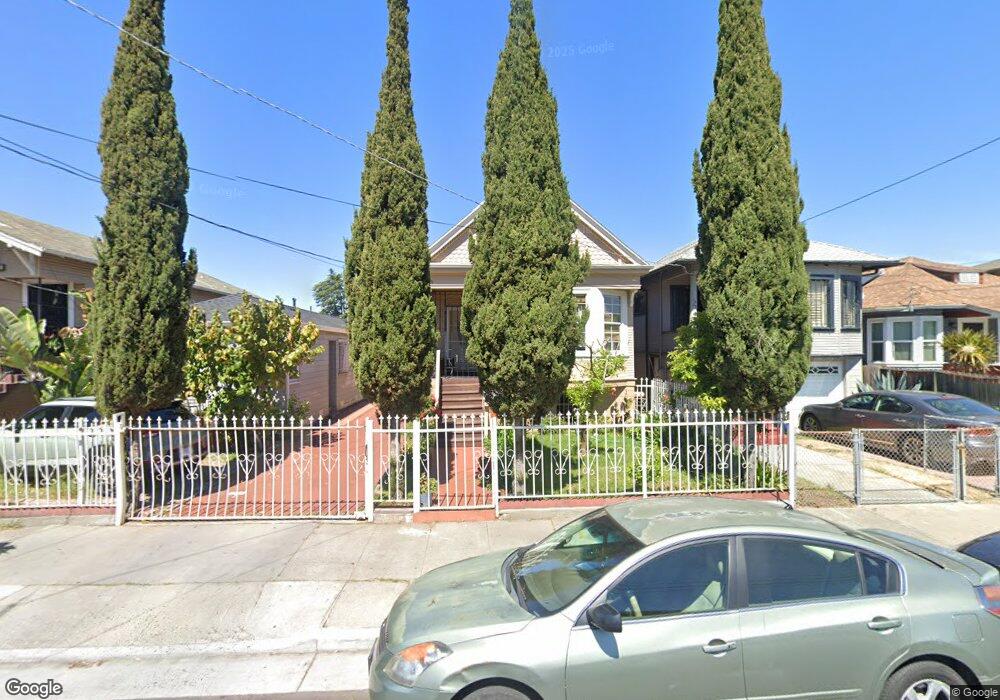
1419 50th Ave Oakland, CA 94601
Fremont NeighborhoodEstimated Value: $541,000
3
Beds
1
Bath
1,648
Sq Ft
$328/Sq Ft
Est. Value
About This Home
This home is located at 1419 50th Ave, Oakland, CA 94601 and is currently estimated at $541,000, approximately $328 per square foot. 1419 50th Ave is a home located in Alameda County with nearby schools including Bridges Academy Elementary School, Greenleaf TK-8, and Coliseum College Prep Academy.
Ownership History
Date
Name
Owned For
Owner Type
Purchase Details
Closed on
Aug 6, 2018
Sold by
Ochoa Maria S
Bought by
Ochoa Maria S and Maria S Ochoa Living Trust
Current Estimated Value
Purchase Details
Closed on
Oct 15, 2004
Sold by
Ochoa Jose S and Ochoa Maria S
Bought by
Ochoa Jose S and Ochoa Maria S
Home Financials for this Owner
Home Financials are based on the most recent Mortgage that was taken out on this home.
Original Mortgage
$213,500
Interest Rate
5.74%
Mortgage Type
Commercial
Create a Home Valuation Report for This Property
The Home Valuation Report is an in-depth analysis detailing your home's value as well as a comparison with similar homes in the area
Home Values in the Area
Average Home Value in this Area
Purchase History
| Date | Buyer | Sale Price | Title Company |
|---|---|---|---|
| Ochoa Maria S | -- | None Available | |
| Ochoa Jose S | -- | Chicago Title Co |
Source: Public Records
Mortgage History
| Date | Status | Borrower | Loan Amount |
|---|---|---|---|
| Closed | Ochoa Jose S | $213,500 |
Source: Public Records
Tax History Compared to Growth
Tax History
| Year | Tax Paid | Tax Assessment Tax Assessment Total Assessment is a certain percentage of the fair market value that is determined by local assessors to be the total taxable value of land and additions on the property. | Land | Improvement |
|---|---|---|---|---|
| 2025 | $3,181 | $59,384 | $20,973 | $38,411 |
| 2024 | $3,181 | $58,220 | $20,562 | $37,658 |
| 2023 | $3,155 | $57,079 | $20,159 | $36,920 |
| 2022 | $2,917 | $55,959 | $19,763 | $36,196 |
| 2021 | $2,553 | $54,862 | $19,376 | $35,486 |
| 2020 | $2,519 | $54,300 | $19,177 | $35,123 |
| 2019 | $2,275 | $53,235 | $18,801 | $34,434 |
| 2018 | $2,227 | $52,191 | $18,432 | $33,759 |
| 2017 | $2,083 | $51,168 | $18,071 | $33,097 |
| 2016 | $1,920 | $50,165 | $17,717 | $32,448 |
| 2015 | $1,902 | $49,412 | $17,451 | $31,961 |
| 2014 | $1,925 | $48,444 | $17,109 | $31,335 |
Source: Public Records
Map
Nearby Homes