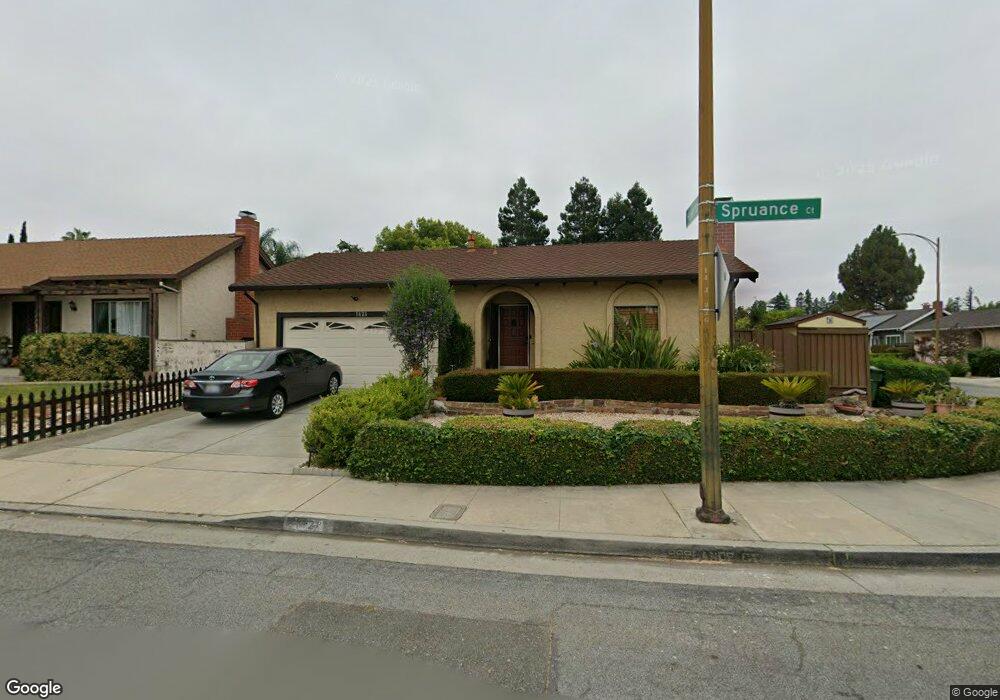
1421 Spruance Ct San Jose, CA 95128
Fruitdale NeighborhoodEstimated Value: $1,649,000 - $1,817,000
3
Beds
2
Baths
1,497
Sq Ft
$1,169/Sq Ft
Est. Value
About This Home
This home is located at 1421 Spruance Ct, San Jose, CA 95128 and is currently estimated at $1,749,985, approximately $1,168 per square foot. 1421 Spruance Ct is a home located in Santa Clara County with nearby schools including Del Mar High School, Blackford Elementary, and Sherman Oaks Elementary School.
Ownership History
Date
Name
Owned For
Owner Type
Purchase Details
Closed on
Aug 13, 1998
Sold by
Schock Steven L and Schock Rosemary D
Bought by
Falcon Nelly
Current Estimated Value
Home Financials for this Owner
Home Financials are based on the most recent Mortgage that was taken out on this home.
Original Mortgage
$279,950
Outstanding Balance
$58,200
Interest Rate
6.88%
Estimated Equity
$1,691,785
Create a Home Valuation Report for This Property
The Home Valuation Report is an in-depth analysis detailing your home's value as well as a comparison with similar homes in the area
Home Values in the Area
Average Home Value in this Area
Purchase History
| Date | Buyer | Sale Price | Title Company |
|---|---|---|---|
| Falcon Nelly | $350,000 | Chicago Title Co |
Source: Public Records
Mortgage History
| Date | Status | Borrower | Loan Amount |
|---|---|---|---|
| Open | Falcon Nelly | $279,950 | |
| Closed | Falcon Nelly | $50,000 |
Source: Public Records
Tax History Compared to Growth
Tax History
| Year | Tax Paid | Tax Assessment Tax Assessment Total Assessment is a certain percentage of the fair market value that is determined by local assessors to be the total taxable value of land and additions on the property. | Land | Improvement |
|---|---|---|---|---|
| 2025 | $8,045 | $548,594 | $383,921 | $164,673 |
| 2024 | $8,045 | $537,839 | $376,394 | $161,445 |
| 2023 | $7,872 | $527,294 | $369,014 | $158,280 |
| 2022 | $7,827 | $516,956 | $361,779 | $155,177 |
| 2021 | $7,644 | $506,821 | $354,686 | $152,135 |
| 2020 | $7,426 | $501,626 | $351,050 | $150,576 |
| 2019 | $7,314 | $491,791 | $344,167 | $147,624 |
| 2018 | $7,110 | $482,149 | $337,419 | $144,730 |
| 2017 | $7,016 | $472,696 | $330,803 | $141,893 |
| 2016 | $6,633 | $463,428 | $324,317 | $139,111 |
| 2015 | $6,539 | $456,468 | $319,446 | $137,022 |
| 2014 | $5,901 | $447,527 | $313,189 | $134,338 |
Source: Public Records
Map
Nearby Homes
- 138 Quail Hollow Dr Unit 138
- 160 Quail Hollow Dr Unit 160A
- 1445 S Bascom Ave Unit 47
- 26 Quail Hollow Dr Unit 26
- 919 Ravenscourt Ave
- 177 Quail Hollow Dr Unit 117
- 90 Quail Hollow Dr Unit 90
- 1006 Almarida Dr
- 1405 Allegado Alley Unit 86
- 2067 Sonador Commons
- 2043 Sonador Commons
- 287 Watson Dr Unit 4
- 390 N 1st St Unit 2
- 1189 N Central Ave
- 912 Campisi Way Unit 115
- 912 Campisi Way Unit 201
- 1990 Southwest Expy
- 665 Hawthorne Ave
- 178 Salmar Terrace
- 1874 Huxley Ct
- 1425 Spruance Ct
- 1424 Lujoso Ct
- 1429 Spruance Ct
- 1428 Lujoso Ct
- 2457 Huerto Dr
- 2463 Huerto Dr
- 1432 Lujoso Ct
- 144 Quail Hollow Dr Unit E
- 144 Quail Hollow Dr Unit 144 C
- 144 Quail Hollow Dr Unit 144E
- 144E Quail Hollow Dr Unit 144e
- 144A Quail Hollow Dr Unit 144A
- 144B Quail Hollow Dr
- 144 Quail Hollow Dr Unit F
- 144 Quail Hollow Dr Unit 144 C144 C
- 144 Quail Hollow Dr Unit 144E144E
- 144E Quail Hollow Dr Unit 144e144e
- 144A Quail Hollow Dr Unit 144A144A
- 144E Quail Hollow Dr
- 144 Quail Hollow Dr Unit 144 C