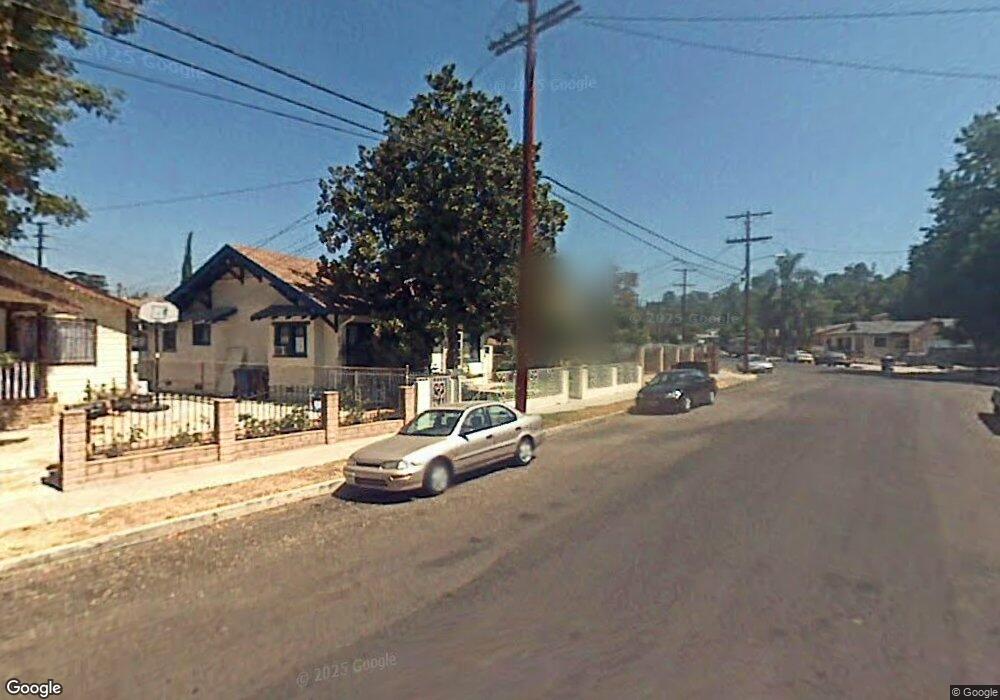
1423 Hepner Ave Los Angeles, CA 90041
Eagle Rock NeighborhoodEstimated Value: $1,300,000 - $1,867,000
5
Beds
3
Baths
2,291
Sq Ft
$680/Sq Ft
Est. Value
About This Home
This home is located at 1423 Hepner Ave, Los Angeles, CA 90041 and is currently estimated at $1,556,793, approximately $679 per square foot. 1423 Hepner Ave is a home located in Los Angeles County with nearby schools including Rockdale Elementary School, Eagle Rock High School, and PUC CALS Middle School and Early College High.
Ownership History
Date
Name
Owned For
Owner Type
Purchase Details
Closed on
Dec 20, 2017
Sold by
Rodriguez Patricia J
Bought by
Rodriguez Patricia J
Current Estimated Value
Home Financials for this Owner
Home Financials are based on the most recent Mortgage that was taken out on this home.
Original Mortgage
$302,000
Outstanding Balance
$254,323
Interest Rate
3.95%
Mortgage Type
New Conventional
Estimated Equity
$1,302,470
Purchase Details
Closed on
Mar 9, 2016
Sold by
Rodriguez Mario A
Bought by
Rodriguez Patricia Jeannette
Purchase Details
Closed on
Mar 6, 1995
Sold by
Carpenter Jean Marie
Bought by
Rodriguez Mario and Rodriguez Noemi
Home Financials for this Owner
Home Financials are based on the most recent Mortgage that was taken out on this home.
Original Mortgage
$112,000
Interest Rate
9.21%
Purchase Details
Closed on
Nov 7, 1994
Sold by
Rodriguez Mario A
Bought by
Rodriguez Mario A and Rodriguez Noemi
Create a Home Valuation Report for This Property
The Home Valuation Report is an in-depth analysis detailing your home's value as well as a comparison with similar homes in the area
Home Values in the Area
Average Home Value in this Area
Purchase History
| Date | Buyer | Sale Price | Title Company |
|---|---|---|---|
| Rodriguez Patricia J | -- | Chicago Title | |
| Rodriguez Patricia Jeannette | -- | None Available | |
| Rodriguez Mario | $140,000 | Stewart Title Company | |
| Rodriguez Mario A | -- | -- |
Source: Public Records
Mortgage History
| Date | Status | Borrower | Loan Amount |
|---|---|---|---|
| Open | Rodriguez Patricia J | $302,000 | |
| Closed | Rodriguez Mario | $112,000 |
Source: Public Records
Tax History Compared to Growth
Tax History
| Year | Tax Paid | Tax Assessment Tax Assessment Total Assessment is a certain percentage of the fair market value that is determined by local assessors to be the total taxable value of land and additions on the property. | Land | Improvement |
|---|---|---|---|---|
| 2025 | $3,193 | $242,054 | $58,814 | $183,240 |
| 2024 | $3,193 | $237,309 | $57,661 | $179,648 |
| 2023 | $3,136 | $232,657 | $56,531 | $176,126 |
| 2022 | $2,997 | $228,096 | $55,423 | $172,673 |
| 2021 | $2,949 | $223,625 | $54,337 | $169,288 |
| 2019 | $2,866 | $216,994 | $52,726 | $164,268 |
| 2018 | $2,759 | $212,741 | $51,693 | $161,048 |
| 2017 | $2,699 | $208,571 | $50,680 | $157,891 |
| 2016 | $2,613 | $204,483 | $49,687 | $154,796 |
| 2015 | $2,577 | $201,412 | $48,941 | $152,471 |
| 2014 | $2,594 | $197,468 | $47,983 | $149,485 |
Source: Public Records
Map
Nearby Homes
- 1359 Wildwood Dr
- 4631 4637 Loleta Place
- 1321 Wildwood Dr
- 1333 Wildwood Dr
- 4879 Hartwick St
- 4764 Wiota St
- 4890 Floristan Ave
- 1584 Oak Grove Place
- 1325 Linda Rosa Ave
- 1200 Saginaw St
- 1026 Oak Grove Dr
- 5829 Tipton Way
- 1632 Oak Grove Dr
- 1938 Phillips Way
- 1915 N Avenue 52
- 1942 Phillips Way
- 1932 Phillips Way
- 5318 Raber St
- 1440 Holbrook St
- 4984 Vincent Ave
- 1425 Hepner Ave
- 1417 Hepner Ave
- 1431 Hepner Ave
- 1411 Hepner Ave
- 1441 Hepner Ave
- 1420 Yosemite Dr
- 1426 Hepner Ave
- 4757 Avoca St
- 4751 Avoca St
- 1443 Hepner Ave
- 1426 Yosemite Dr
- 1412 Yosemite Dr
- 1423 Oak Grove Dr
- 1419 Oak Grove Dr
- 1416 Yosemite Dr
- 1439 Oak Grove Dr
- 1412 Hepner Ave
- 1443 Oak Grove Dr
- 1430 Yosemite Dr
- 1429 Oak Grove Dr