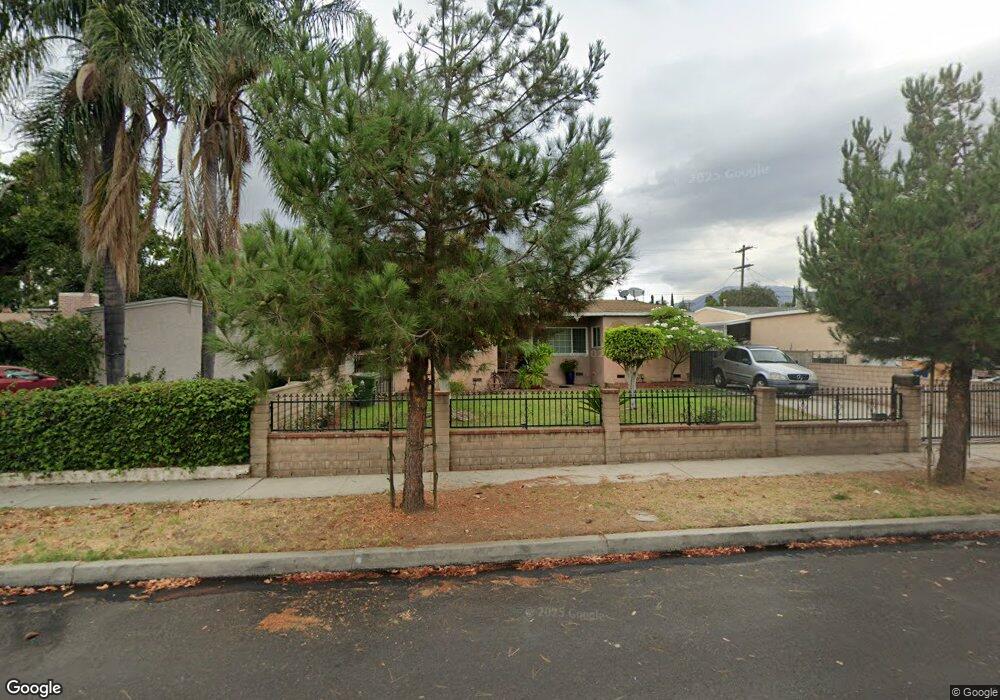
14243 Aztec St Sylmar, CA 91342
Estimated Value: $732,000 - $807,000
3
Beds
2
Baths
1,355
Sq Ft
$565/Sq Ft
Est. Value
About This Home
This home is located at 14243 Aztec St, Sylmar, CA 91342 and is currently estimated at $765,737, approximately $565 per square foot. 14243 Aztec St is a home located in Los Angeles County with nearby schools including Dyer Street Elementary School, Olive Vista Middle School, and San Fernando Senior High School.
Ownership History
Date
Name
Owned For
Owner Type
Purchase Details
Closed on
Sep 22, 2023
Sold by
Flores Jose Rafael and Flores Maria Luisa
Bought by
Flores Family Living Trust and Flores
Current Estimated Value
Purchase Details
Closed on
Sep 10, 2002
Sold by
Rodas Dora
Bought by
Flores Jose R and Flores Maria L
Home Financials for this Owner
Home Financials are based on the most recent Mortgage that was taken out on this home.
Original Mortgage
$140,000
Interest Rate
5.99%
Purchase Details
Closed on
Dec 31, 1996
Sold by
Garcia Enrique
Bought by
Rodas Dora and Flores Damaris
Home Financials for this Owner
Home Financials are based on the most recent Mortgage that was taken out on this home.
Original Mortgage
$140,827
Interest Rate
7.74%
Mortgage Type
FHA
Create a Home Valuation Report for This Property
The Home Valuation Report is an in-depth analysis detailing your home's value as well as a comparison with similar homes in the area
Home Values in the Area
Average Home Value in this Area
Purchase History
| Date | Buyer | Sale Price | Title Company |
|---|---|---|---|
| Flores Family Living Trust | -- | None Listed On Document | |
| Flores Jose R | -- | First American Title Co | |
| Rodas Dora | $143,000 | American Title Ins Co |
Source: Public Records
Mortgage History
| Date | Status | Borrower | Loan Amount |
|---|---|---|---|
| Previous Owner | Flores Jose R | $140,000 | |
| Previous Owner | Rodas Dora | $140,827 |
Source: Public Records
Tax History Compared to Growth
Tax History
| Year | Tax Paid | Tax Assessment Tax Assessment Total Assessment is a certain percentage of the fair market value that is determined by local assessors to be the total taxable value of land and additions on the property. | Land | Improvement |
|---|---|---|---|---|
| 2025 | $4,030 | $325,851 | $209,997 | $115,854 |
| 2024 | $4,030 | $319,463 | $205,880 | $113,583 |
| 2023 | $3,954 | $313,200 | $201,844 | $111,356 |
| 2022 | $3,773 | $307,060 | $197,887 | $109,173 |
| 2021 | $3,721 | $301,040 | $194,007 | $107,033 |
| 2019 | $3,610 | $292,112 | $188,253 | $103,859 |
| 2018 | $3,513 | $286,385 | $184,562 | $101,823 |
| 2016 | $3,345 | $275,267 | $177,397 | $97,870 |
| 2015 | $3,296 | $271,133 | $174,733 | $96,400 |
| 2014 | $3,314 | $265,823 | $171,311 | $94,512 |
Source: Public Records
Map
Nearby Homes
- 14263 Hubbard St
- 12446 Herrick Ave
- 14335 Aztec St
- 14388 Beaver St
- 316 Orange Grove Ave
- 14073 Aztec St
- 14052 Aztec St
- 428 Fermoore St
- 1933 Glenoaks Blvd Unit 127
- 431 N Workman St
- 1921 Glenoaks Blvd Unit 196
- 12563 Bradley Ave Unit 13
- 1926 Lucas St Unit 2
- 14365 Berg St
- 643 Harding Ave
- 14761 Astoria St
- 556 Harps St
- 12796 Norris Ave
- 14529 Paddock St
- 14909 W Navarre Way
- 14237 Aztec St
- 14249 Aztec St
- 14253 Aztec St
- 14231 Aztec St
- 14272 Beaver St
- 14278 Beaver St
- 14266 Beaver St
- 14259 Aztec St
- 14282 Beaver St
- 14260 Beaver St
- 14242 Aztec St
- 14288 Beaver St
- 14248 Aztec St
- 14236 Aztec St
- 14252 Aztec St
- 14265 Aztec St
- 14230 Aztec St
- 12518 Herrick Ave
- 14300 Beaver St
- 12524 Herrick Ave