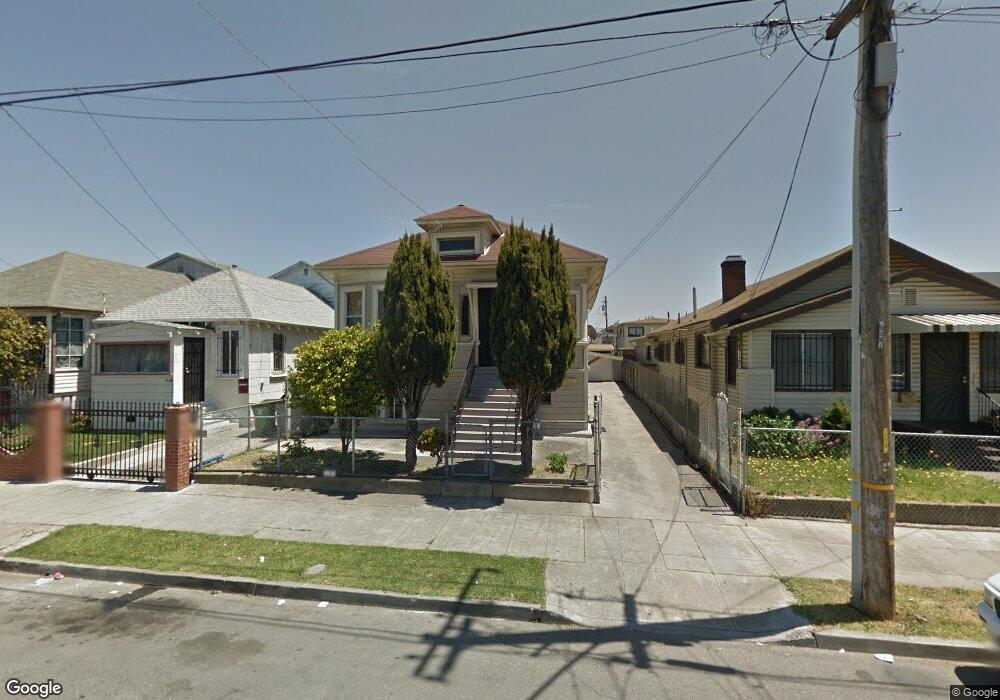
1426 51st Ave Oakland, CA 94601
Fremont NeighborhoodEstimated Value: $426,773 - $510,000
2
Beds
2
Baths
1,204
Sq Ft
$394/Sq Ft
Est. Value
About This Home
This home is located at 1426 51st Ave, Oakland, CA 94601 and is currently estimated at $474,193, approximately $393 per square foot. 1426 51st Ave is a home located in Alameda County with nearby schools including Bridges Academy Elementary School, Greenleaf TK-8, and Coliseum College Prep Academy.
Ownership History
Date
Name
Owned For
Owner Type
Purchase Details
Closed on
May 1, 2003
Sold by
Perez Jose R and Perez Cristina
Bought by
Perez Viramontes Sergio and Irrevocable Trust Of Jose R &
Current Estimated Value
Purchase Details
Closed on
Mar 9, 1994
Sold by
Rodriguez Maria Melchor and Viade Perez Maria Melchor Rodriguez
Bought by
Perez Demetrio and Perez Leticia
Home Financials for this Owner
Home Financials are based on the most recent Mortgage that was taken out on this home.
Original Mortgage
$78,750
Interest Rate
6.6%
Create a Home Valuation Report for This Property
The Home Valuation Report is an in-depth analysis detailing your home's value as well as a comparison with similar homes in the area
Home Values in the Area
Average Home Value in this Area
Purchase History
| Date | Buyer | Sale Price | Title Company |
|---|---|---|---|
| Perez Viramontes Sergio | -- | -- | |
| Perez Demetrio | $105,000 | Fidelity National Title Ins |
Source: Public Records
Mortgage History
| Date | Status | Borrower | Loan Amount |
|---|---|---|---|
| Closed | Perez Demetrio | $78,750 | |
| Closed | Perez Demetrio | $10,500 |
Source: Public Records
Tax History Compared to Growth
Tax History
| Year | Tax Paid | Tax Assessment Tax Assessment Total Assessment is a certain percentage of the fair market value that is determined by local assessors to be the total taxable value of land and additions on the property. | Land | Improvement |
|---|---|---|---|---|
| 2025 | $4,004 | $174,421 | $52,326 | $122,095 |
| 2024 | $4,004 | $171,001 | $51,300 | $119,701 |
| 2023 | $4,098 | $167,648 | $50,294 | $117,354 |
| 2022 | $3,931 | $164,361 | $49,308 | $115,053 |
| 2021 | $3,630 | $161,140 | $48,342 | $112,798 |
| 2020 | $3,589 | $159,488 | $47,846 | $111,642 |
| 2019 | $3,373 | $156,361 | $46,908 | $109,453 |
| 2018 | $3,307 | $153,296 | $45,989 | $107,307 |
| 2017 | $3,151 | $150,291 | $45,087 | $105,204 |
| 2016 | $2,970 | $147,344 | $44,203 | $103,141 |
| 2015 | $2,952 | $145,132 | $43,539 | $101,593 |
| 2014 | $2,891 | $142,290 | $42,687 | $99,603 |
Source: Public Records
Map
Nearby Homes