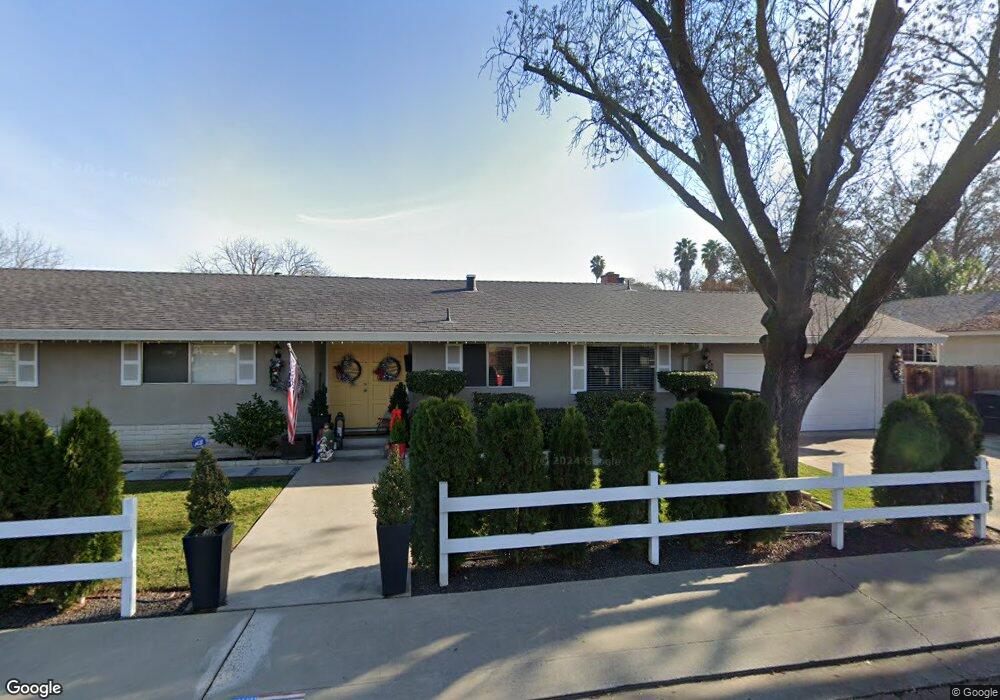
1428 Stuben Way Modesto, CA 95355
Northeast Modesto NeighborhoodEstimated Value: $458,305 - $481,000
3
Beds
2
Baths
1,552
Sq Ft
$300/Sq Ft
Est. Value
About This Home
This home is located at 1428 Stuben Way, Modesto, CA 95355 and is currently estimated at $466,326, approximately $300 per square foot. 1428 Stuben Way is a home located in Stanislaus County with nearby schools including Rose Avenue Elementary School, La Loma Jr High, and Thomas Downey High School.
Ownership History
Date
Name
Owned For
Owner Type
Purchase Details
Closed on
Jul 26, 2018
Sold by
Tubera Michael G
Bought by
Tubera Samantha A and Tubera Victor
Current Estimated Value
Home Financials for this Owner
Home Financials are based on the most recent Mortgage that was taken out on this home.
Original Mortgage
$294,566
Outstanding Balance
$259,233
Interest Rate
5.5%
Mortgage Type
FHA
Estimated Equity
$207,093
Purchase Details
Closed on
Jul 25, 2018
Sold by
Jackson Jo L
Bought by
Tubera Samantha A and Tubera Victor
Home Financials for this Owner
Home Financials are based on the most recent Mortgage that was taken out on this home.
Original Mortgage
$294,566
Outstanding Balance
$259,233
Interest Rate
5.5%
Mortgage Type
FHA
Estimated Equity
$207,093
Purchase Details
Closed on
Oct 30, 2008
Sold by
Brentlinger Yoshie
Bought by
Jackson Jo L
Create a Home Valuation Report for This Property
The Home Valuation Report is an in-depth analysis detailing your home's value as well as a comparison with similar homes in the area
Home Values in the Area
Average Home Value in this Area
Purchase History
| Date | Buyer | Sale Price | Title Company |
|---|---|---|---|
| Tubera Samantha A | -- | First American Title Co | |
| Tubera Samantha A | $300,000 | First American Title Co | |
| Jackson Jo L | -- | None Available |
Source: Public Records
Mortgage History
| Date | Status | Borrower | Loan Amount |
|---|---|---|---|
| Open | Tubera Samantha A | $294,566 |
Source: Public Records
Tax History
| Year | Tax Paid | Tax Assessment Tax Assessment Total Assessment is a certain percentage of the fair market value that is determined by local assessors to be the total taxable value of land and additions on the property. | Land | Improvement |
|---|---|---|---|---|
| 2025 | $3,913 | $334,650 | $145,015 | $189,635 |
| 2024 | $3,738 | $328,089 | $142,172 | $185,917 |
| 2023 | $3,683 | $321,657 | $139,385 | $182,272 |
| 2022 | $3,594 | $315,351 | $136,652 | $178,699 |
| 2021 | $3,380 | $309,169 | $133,973 | $175,196 |
| 2020 | $3,447 | $306,000 | $132,600 | $173,400 |
| 2019 | $3,367 | $300,000 | $130,000 | $170,000 |
| 2018 | $731 | $74,108 | $14,929 | $59,179 |
| 2017 | $712 | $72,656 | $14,637 | $58,019 |
| 2016 | $697 | $71,232 | $14,350 | $56,882 |
| 2015 | $687 | $70,163 | $14,135 | $56,028 |
| 2014 | -- | $68,790 | $13,859 | $54,931 |
Source: Public Records
Map
Nearby Homes
- 1805 Kienitz Ave
- 1805 E Orangeburg Ave
- 1509 Duportail Ave
- 1313 Sharonwood Dr
- 1309 Nelda Way
- 1312 Wylmawood Ln
- 1530 Morene Way
- 1608 Kruger Dr
- 1512 Kruger Dr
- 1428 Kent Way
- 1440 Kruger Dr
- 1517 Rosario Ave
- 1813 Rose Ave
- 2016 Sweetwater Dr
- 1909 Devin Dr
- 1008 Gemini Ct
- 1713 Wolverine Way
- 1837 Celeste Dr
- 2021 Ellison Dr
- 2307 Oakdale Rd Unit 13
- 1428 Steuben Way
- 1424 Steuben Way
- 1908 Kienitz Ave
- 1905 E Orangeburg Ave
- 1429 Steuben Way
- 1425 Steuben Way
- 1912 Kienitz Ave
- 1828 Kienitz Ave
- 1905 Kienitz Ave
- 1901 Kienitz Ave
- 1829 E Orangeburg Ave
- 1909 Kienitz Ave
- 1900 E Orangeburg Ave
- 1916 Kienitz Ave
- 1913 E Orangeburg Ave
- 1833 Kienitz Ave
- 1904 E Orangeburg Ave
- 1836 E Orangeburg Ave
- 1913 Kienitz Ave
- 1908 E Orangeburg Ave
Your Personal Tour Guide
Ask me questions while you tour the home.