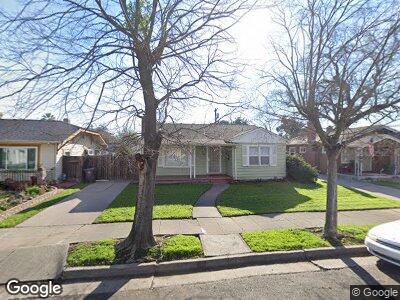
1428 W Elm St Stockton, CA 95203
Midtown NeighborhoodEstimated Value: $322,000 - $450,000
2
Beds
1
Bath
1,117
Sq Ft
$330/Sq Ft
Est. Value
About This Home
This home is located at 1428 W Elm St, Stockton, CA 95203 and is currently estimated at $368,461, approximately $329 per square foot. 1428 W Elm St is a home located in San Joaquin County with nearby schools including Victory Elementary School, El Dorado Elementary School, and Wilson Elementary School.
Ownership History
Date
Name
Owned For
Owner Type
Purchase Details
Closed on
Jun 12, 2013
Sold by
Rajkovich David and Rajkovich Karen
Bought by
Peed Robert M and Peed Cheryl J
Current Estimated Value
Purchase Details
Closed on
Aug 7, 2009
Sold by
Deutsche Bank National Trust Company
Bought by
Rajkovich David and Rajkovich Karen
Purchase Details
Closed on
Apr 14, 2009
Sold by
Haliburton Frederick
Bought by
Deutsche Bank National Trust Company
Purchase Details
Closed on
Aug 26, 2005
Sold by
Brown Kenneth P and Brown Dana M
Bought by
Haliburton Frederick
Home Financials for this Owner
Home Financials are based on the most recent Mortgage that was taken out on this home.
Original Mortgage
$253,600
Interest Rate
6.15%
Mortgage Type
Purchase Money Mortgage
Purchase Details
Closed on
Feb 25, 2002
Sold by
Brown Ken P and Brown Dana M
Bought by
Brown Kenneth P and Brown Dana M
Create a Home Valuation Report for This Property
The Home Valuation Report is an in-depth analysis detailing your home's value as well as a comparison with similar homes in the area
Home Values in the Area
Average Home Value in this Area
Purchase History
| Date | Buyer | Sale Price | Title Company |
|---|---|---|---|
| Peed Robert M | -- | Old Republic Title Company | |
| Rajkovich David | $72,500 | Old Republic Title Company | |
| Deutsche Bank National Trust Company | $69,900 | None Available | |
| Haliburton Frederick | $317,000 | Old Republic Title Co | |
| Brown Kenneth P | -- | -- |
Source: Public Records
Mortgage History
| Date | Status | Borrower | Loan Amount |
|---|---|---|---|
| Previous Owner | Haliburton Frederick | $253,600 |
Source: Public Records
Tax History Compared to Growth
Tax History
| Year | Tax Paid | Tax Assessment Tax Assessment Total Assessment is a certain percentage of the fair market value that is determined by local assessors to be the total taxable value of land and additions on the property. | Land | Improvement |
|---|---|---|---|---|
| 2024 | $1,615 | $120,719 | $30,178 | $90,541 |
| 2023 | $1,579 | $118,353 | $29,587 | $88,766 |
| 2022 | $1,501 | $116,033 | $29,007 | $87,026 |
| 2021 | $1,444 | $113,759 | $28,439 | $85,320 |
| 2020 | $1,471 | $112,594 | $28,148 | $84,446 |
| 2019 | $1,465 | $110,388 | $27,597 | $82,791 |
| 2018 | $1,439 | $108,224 | $27,056 | $81,168 |
| 2017 | $1,365 | $106,103 | $26,526 | $79,577 |
| 2016 | $1,389 | $104,023 | $26,006 | $78,017 |
| 2014 | $1,324 | $100,455 | $25,114 | $75,341 |
Source: Public Records
Map
Nearby Homes
- 1228 W Walnut St
- 1545 W Walnut St
- 1136 W Elm St
- 1602 W Harding Way
- 1054 W Willow St
- 1605 Argonne Dr
- 1715 S Tuxedo Ave
- 1551 Roselawn Ave
- 1148 W Rose St
- 1112 S Country Club Blvd
- 1510 Elmwood Ave
- 1035 Middlefield Ave
- 907 N Pershing Ave
- 838 W Elm St
- 1835 Lucerne Ave
- 1161 N Country Club Blvd
- 1837 Lucerne Ave
- 2116 Mission Rd
- 1871 Jewell Ct
- 1601 N Baker St
- 1428 W Elm St
- 1436 W Elm St
- 1420 W Elm St
- 1446 W Elm St
- 1425 W Harding Way
- 1435 W Harding Way
- 1421 W Harding Way
- 1529 N Pershing Ave
- 1517 N Pershing Ave
- 1445 W Harding Way
- 1409 W Harding Way
- 1427 W Elm St
- 1452 W Elm St
- 1435 W Elm St
- 1421 W Elm St
- 1443 W Elm St
- 1455 W Harding Way
- 1411 W Elm St
- 1458 W Elm St