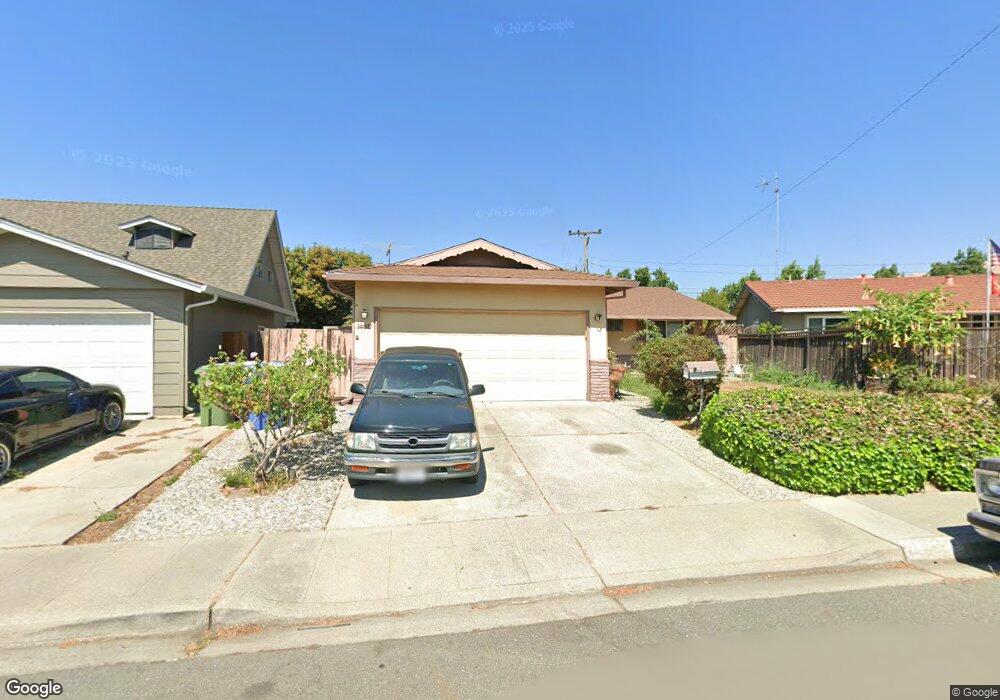
1429 Acadia Ave Milpitas, CA 95035
Estimated Value: $1,320,999 - $1,451,000
3
Beds
2
Baths
1,176
Sq Ft
$1,167/Sq Ft
Est. Value
About This Home
This home is located at 1429 Acadia Ave, Milpitas, CA 95035 and is currently estimated at $1,372,000, approximately $1,166 per square foot. 1429 Acadia Ave is a home located in Santa Clara County with nearby schools including Robert Randall Elementary School, Alexander Rose Elementary School, and Rancho Milpitas Middle School.
Ownership History
Date
Name
Owned For
Owner Type
Purchase Details
Closed on
Oct 29, 2010
Sold by
Bickford Janice L and Friesen Julie Elaine
Bought by
Quach Lee S and Guo Helen
Current Estimated Value
Home Financials for this Owner
Home Financials are based on the most recent Mortgage that was taken out on this home.
Original Mortgage
$311,250
Outstanding Balance
$202,514
Interest Rate
4%
Mortgage Type
New Conventional
Estimated Equity
$1,169,486
Purchase Details
Closed on
Jul 19, 2010
Sold by
Bickford Janice L and Friesen Julie Elaine
Bought by
Bickford Janice L and Friesen Julie Elaine
Home Financials for this Owner
Home Financials are based on the most recent Mortgage that was taken out on this home.
Original Mortgage
$137,274
Interest Rate
4.68%
Mortgage Type
New Conventional
Create a Home Valuation Report for This Property
The Home Valuation Report is an in-depth analysis detailing your home's value as well as a comparison with similar homes in the area
Home Values in the Area
Average Home Value in this Area
Purchase History
| Date | Buyer | Sale Price | Title Company |
|---|---|---|---|
| Quach Lee S | $415,000 | Old Republic Title Company | |
| Bickford Janice L | -- | North American Title Co Inc | |
| Friesen Julie Elaine | -- | North American Title Co Inc |
Source: Public Records
Mortgage History
| Date | Status | Borrower | Loan Amount |
|---|---|---|---|
| Open | Quach Lee S | $311,250 | |
| Previous Owner | Bickford Janice L | $137,274 |
Source: Public Records
Tax History
| Year | Tax Paid | Tax Assessment Tax Assessment Total Assessment is a certain percentage of the fair market value that is determined by local assessors to be the total taxable value of land and additions on the property. | Land | Improvement |
|---|---|---|---|---|
| 2025 | $6,227 | $531,676 | $398,696 | $132,980 |
| 2024 | $6,227 | $521,252 | $390,879 | $130,373 |
| 2023 | $6,207 | $511,032 | $383,215 | $127,817 |
| 2022 | $6,184 | $501,012 | $375,701 | $125,311 |
| 2021 | $6,095 | $491,189 | $368,335 | $122,854 |
| 2020 | $5,990 | $486,154 | $364,559 | $121,595 |
| 2019 | $5,924 | $476,622 | $357,411 | $119,211 |
| 2018 | $5,630 | $467,277 | $350,403 | $116,874 |
| 2017 | $5,558 | $458,116 | $343,533 | $114,583 |
| 2016 | $5,333 | $449,135 | $336,798 | $112,337 |
| 2015 | $5,279 | $442,389 | $331,739 | $110,650 |
| 2014 | $5,132 | $433,724 | $325,241 | $108,483 |
Source: Public Records
Map
Nearby Homes
- 1260 Glacier Dr
- 397 S Park Victoria Dr
- 484 Dempsey Rd Unit 186
- 496 Dempsey Rd Unit 199
- 1490 Mount Diablo Ave
- 136 Lawton Dr
- 808 Cameron Cir
- 1759 Tahoe Dr
- 2235 Skyline Dr
- 2202 Yosemite Dr
- 1430 Cuciz Ln
- 25 Terfidia Ln
- 258 Lynn Ave
- 2144 Ashwood Ln
- 861 Garden St
- 2085 Ashwood Ln
- 2074 Ashwood Ln
- 3647 Madrid Dr
- 672 Amalfi Loop
- 3659 Madrid Ct
- 1419 Acadia Ave
- 1437 Acadia Ave
- 1420 Yosemite Dr
- 1430 Yosemite Dr
- 1409 Acadia Ave
- 1410 Yosemite Dr
- 1445 Acadia Ave
- 1440 Yosemite Dr
- 1436 Acadia Ave
- 1398 Yosemite Dr
- 1424 Acadia Ave
- 1397 Acadia Ave
- 1450 Yosemite Dr
- 1414 Acadia Ave
- 1388 Yosemite Dr
- 1448 Acadia Ave
- 1404 Acadia Ave
- 1387 Acadia Ave
- 1378 Yosemite Dr
- 1431 Glacier Dr
Your Personal Tour Guide
Ask me questions while you tour the home.