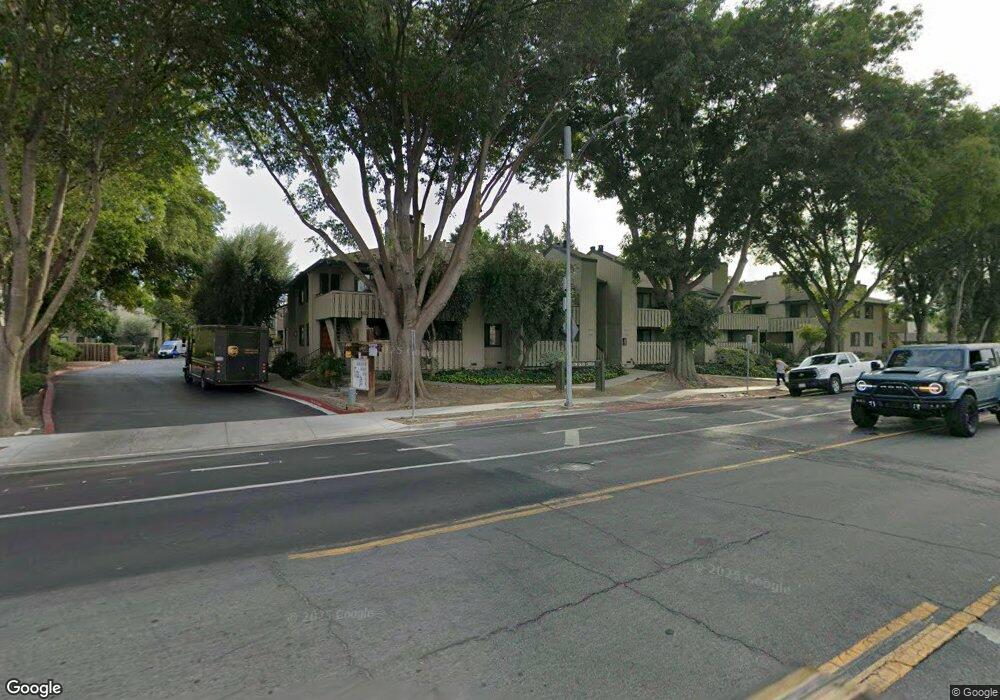
1429 Alma Loop Unit 206 San Jose, CA 95125
Willow Glen NeighborhoodEstimated Value: $651,000 - $775,000
2
Beds
2
Baths
1,054
Sq Ft
$658/Sq Ft
Est. Value
About This Home
This home is located at 1429 Alma Loop Unit 206, San Jose, CA 95125 and is currently estimated at $693,146, approximately $657 per square foot. 1429 Alma Loop Unit 206 is a home located in Santa Clara County with nearby schools including Ernesto Galarza Elementary School, Willow Glen Middle, and Willow Glen High School.
Ownership History
Date
Name
Owned For
Owner Type
Purchase Details
Closed on
Apr 4, 2001
Sold by
Loro Nadene
Bought by
Collet Kimberly R
Current Estimated Value
Home Financials for this Owner
Home Financials are based on the most recent Mortgage that was taken out on this home.
Original Mortgage
$248,000
Outstanding Balance
$91,899
Interest Rate
7.09%
Mortgage Type
Purchase Money Mortgage
Estimated Equity
$601,247
Purchase Details
Closed on
Oct 15, 1997
Sold by
Engler Kenneth D and Engler Ada M
Bought by
Loro Nadene
Home Financials for this Owner
Home Financials are based on the most recent Mortgage that was taken out on this home.
Original Mortgage
$151,050
Interest Rate
7.49%
Mortgage Type
Purchase Money Mortgage
Create a Home Valuation Report for This Property
The Home Valuation Report is an in-depth analysis detailing your home's value as well as a comparison with similar homes in the area
Home Values in the Area
Average Home Value in this Area
Purchase History
| Date | Buyer | Sale Price | Title Company |
|---|---|---|---|
| Collet Kimberly R | $310,000 | North American Title Co | |
| Loro Nadene | $159,000 | North American Title Co |
Source: Public Records
Mortgage History
| Date | Status | Borrower | Loan Amount |
|---|---|---|---|
| Open | Collet Kimberly R | $248,000 | |
| Previous Owner | Loro Nadene | $151,050 |
Source: Public Records
Tax History Compared to Growth
Tax History
| Year | Tax Paid | Tax Assessment Tax Assessment Total Assessment is a certain percentage of the fair market value that is determined by local assessors to be the total taxable value of land and additions on the property. | Land | Improvement |
|---|---|---|---|---|
| 2025 | $5,918 | $467,095 | $186,835 | $280,260 |
| 2024 | $5,918 | $457,937 | $183,172 | $274,765 |
| 2023 | $5,806 | $448,959 | $179,581 | $269,378 |
| 2022 | $5,774 | $440,157 | $176,060 | $264,097 |
| 2021 | $5,667 | $431,527 | $172,608 | $258,919 |
| 2020 | $5,574 | $427,104 | $170,839 | $256,265 |
| 2019 | $5,472 | $418,731 | $167,490 | $251,241 |
| 2018 | $5,424 | $410,521 | $164,206 | $246,315 |
| 2017 | $5,384 | $402,473 | $160,987 | $241,486 |
| 2016 | $5,250 | $394,582 | $157,831 | $236,751 |
| 2015 | $5,211 | $388,656 | $155,461 | $233,195 |
| 2014 | $5,048 | $375,000 | $150,000 | $225,000 |
Source: Public Records
Map
Nearby Homes
- 1427 Alma Loop
- 709 Minnesota Ave
- 1249 Prevost St
- 1326 Milton Way
- 1206 Clark St
- 1610 Carmel Dr
- 501 Minnesota Ave
- 482 Shadowgraph Dr
- 510 Shadowgraph Dr
- 500 Shadowgraph Dr
- 1275 Bird Ave
- 331 Shadow Run Dr
- 271 Shadow Dance Dr
- 1376 Palm St
- 1124 Delmas Ave
- 237 Shadow Dance Dr
- 316 Stonegate Cir
- 1148 Palm St
- 975 Prevost St
- 0 Willow Glen Way
- 1423 Alma Loop
- 1425 Alma Loop
- 1437 Alma Loop
- 1435 Alma Loop
- 1431 Alma Loop
- 1417 Alma Loop Unit 212
- 1415 Alma Loop
- 1421 Alma Loop
- 1419 Alma Loop
- 1441 Alma Loop Unit 404
- 1445 Alma Loop
- 1443 Alma Loop Unit D401
- 1449 Alma Loop Unit 406
- 1447 Alma Loop
- 1412 Capurso Way Unit B102
- 1410 Capurso Way
- 1418 Capurso Way
- 1420 Capurso Way
- 550 W Alma Ave
- 1424 Capurso Way