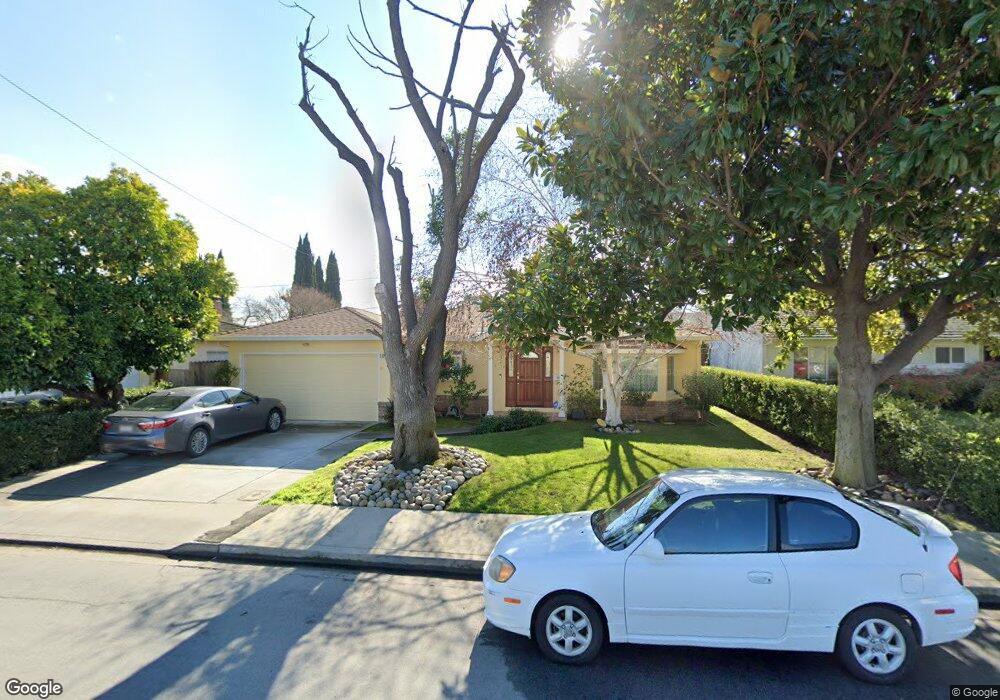
1429 Lloyd Way Mountain View, CA 94040
Mountain View West NeighborhoodEstimated Value: $2,871,976 - $3,552,000
3
Beds
2
Baths
1,577
Sq Ft
$2,093/Sq Ft
Est. Value
About This Home
This home is located at 1429 Lloyd Way, Mountain View, CA 94040 and is currently estimated at $3,300,244, approximately $2,092 per square foot. 1429 Lloyd Way is a home located in Santa Clara County with nearby schools including Springer Elementary School, Georgina P. Blach Junior High School, and Los Altos High School.
Ownership History
Date
Name
Owned For
Owner Type
Purchase Details
Closed on
Jan 26, 2008
Sold by
Veytser Alexander M and Veytser Anna N
Bought by
Veytser Alexander M and Veytser Anna N
Current Estimated Value
Purchase Details
Closed on
May 20, 1994
Sold by
Oshikoji Toorandokht Binesh
Bought by
Veytser Alexander M and Veytser Anna N
Home Financials for this Owner
Home Financials are based on the most recent Mortgage that was taken out on this home.
Original Mortgage
$278,800
Interest Rate
5.87%
Purchase Details
Closed on
Feb 16, 1994
Sold by
Binesh Ismail and Enayatullah Bibikoochek
Bought by
Oshikoji Toorandokht Binesh
Purchase Details
Closed on
Sep 21, 1993
Sold by
Binesh Pirooz and Binesh Ismail
Bought by
Binesh Ismail and Enayatullah Bibikoochek
Create a Home Valuation Report for This Property
The Home Valuation Report is an in-depth analysis detailing your home's value as well as a comparison with similar homes in the area
Home Values in the Area
Average Home Value in this Area
Purchase History
| Date | Buyer | Sale Price | Title Company |
|---|---|---|---|
| Veytser Alexander M | -- | None Available | |
| Veytser Alexander M | $348,500 | North American Title Co Inc | |
| Oshikoji Toorandokht Binesh | -- | North American Title Co Inc | |
| Oshikoji Toorandokht Binesh | -- | North American Title Co Inc | |
| Binesh Ismail | -- | -- |
Source: Public Records
Mortgage History
| Date | Status | Borrower | Loan Amount |
|---|---|---|---|
| Closed | Veytser Alexander M | $278,800 |
Source: Public Records
Tax History
| Year | Tax Paid | Tax Assessment Tax Assessment Total Assessment is a certain percentage of the fair market value that is determined by local assessors to be the total taxable value of land and additions on the property. | Land | Improvement |
|---|---|---|---|---|
| 2025 | $7,796 | $616,867 | $362,583 | $254,284 |
| 2024 | $7,796 | $604,773 | $355,474 | $249,299 |
| 2023 | $7,643 | $592,915 | $348,504 | $244,411 |
| 2022 | $7,584 | $581,290 | $341,671 | $239,619 |
| 2021 | $7,619 | $569,893 | $334,972 | $234,921 |
| 2020 | $7,673 | $564,051 | $331,538 | $232,513 |
| 2019 | $7,331 | $552,992 | $325,038 | $227,954 |
| 2018 | $7,267 | $542,150 | $318,665 | $223,485 |
| 2017 | $7,012 | $531,520 | $312,417 | $219,103 |
| 2016 | $6,827 | $521,099 | $306,292 | $214,807 |
| 2015 | $6,733 | $513,273 | $301,692 | $211,581 |
| 2014 | $6,664 | $503,220 | $295,783 | $207,437 |
Source: Public Records
Map
Nearby Homes
- 948 Rincon St
- 956 Trophy Dr
- 943 Trophy Dr
- 1734 W El Camino Real Unit 7
- 1006 Judson Dr
- 938 Clark Ave Unit 50
- 1910 Mount Vernon Ct Unit 10
- 1515 Miramonte Ave
- 1945 Mount Vernon Ct Unit 3
- 328 Higdon Ave
- 1940 Mount Vernon Ct Unit 1
- 551 Hawthorne Ct
- 236 Higdon Ave
- 613 Paco Dr
- 5100 El Camino Real Unit 108
- 5100 El Camino Real Unit 209
- 100 W El Camino Real Unit 40
- 231 Hope St
- 229 Hope St
- 172 Permanente Way
- 1441 Lloyd Way
- 1417 Lloyd Way
- 1446 Ernestine Ln
- 1420 Ernestine Ln
- 1453 Lloyd Way
- 1405 Lloyd Way
- 1426 Lloyd Way
- 1458 Ernestine Ln
- 1408 Ernestine Ln
- 1438 Lloyd Way
- 1414 Lloyd Way
- 1397 Lloyd Way
- 1465 Lloyd Way
- 1402 Lloyd Way
- 1450 Lloyd Way
- 1376 Ernestine Ln
- 1474 Ernestine Ln
- 1549 Melba Ct
- 1390 Lloyd Way
- 1537 Melba Ct
Your Personal Tour Guide
Ask me questions while you tour the home.