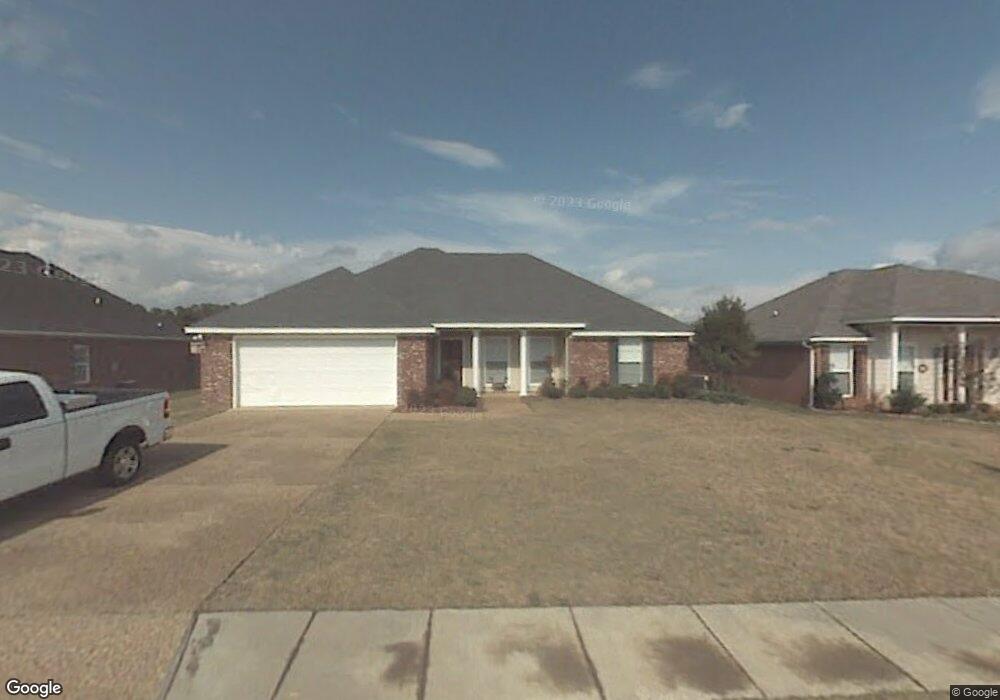
143 Appleridge Dr Brandon, MS 39047
Estimated Value: $238,000 - $253,596
3
Beds
2
Baths
1,502
Sq Ft
$162/Sq Ft
Est. Value
About This Home
This home is located at 143 Appleridge Dr, Brandon, MS 39047 and is currently estimated at $242,899, approximately $161 per square foot. 143 Appleridge Dr is a home located in Rankin County with nearby schools including Oakdale Elementary School, Northwest Rankin Middle School, and Northwest Rankin High School.
Ownership History
Date
Name
Owned For
Owner Type
Purchase Details
Closed on
Jan 30, 2017
Sold by
Feyh Kimberly
Bought by
Rowe Caleb Lane and Richardson Emily Ann
Current Estimated Value
Home Financials for this Owner
Home Financials are based on the most recent Mortgage that was taken out on this home.
Original Mortgage
$154,040
Outstanding Balance
$126,128
Interest Rate
4.32%
Mortgage Type
New Conventional
Estimated Equity
$116,771
Purchase Details
Closed on
Nov 14, 2013
Bought by
Feyh Kimberly
Home Financials for this Owner
Home Financials are based on the most recent Mortgage that was taken out on this home.
Original Mortgage
$117,826
Interest Rate
4.31%
Purchase Details
Closed on
Nov 7, 2008
Sold by
Mers
Bought by
Federal National Mortgage Association
Purchase Details
Closed on
Oct 27, 2008
Sold by
Mckay Michael S
Bought by
Mers As Nominee For Realty Mortgage Corp
Create a Home Valuation Report for This Property
The Home Valuation Report is an in-depth analysis detailing your home's value as well as a comparison with similar homes in the area
Purchase History
| Date | Buyer | Sale Price | Title Company |
|---|---|---|---|
| Rowe Caleb Lane | -- | None Available | |
| Feyh Kimberly | $120,000 | -- | |
| Federal National Mortgage Association | -- | -- | |
| Mers As Nominee For Realty Mortgage Corp | $128,480 | -- |
Source: Public Records
Mortgage History
| Date | Status | Borrower | Loan Amount |
|---|---|---|---|
| Open | Rowe Caleb Lane | $154,040 | |
| Previous Owner | Feyh Kimberly | $117,826 |
Source: Public Records
Tax History
| Year | Tax Paid | Tax Assessment Tax Assessment Total Assessment is a certain percentage of the fair market value that is determined by local assessors to be the total taxable value of land and additions on the property. | Land | Improvement |
|---|---|---|---|---|
| 2025 | $1,503 | $15,883 | $0 | $0 |
| 2024 | $1,411 | $15,883 | $0 | $0 |
| 2023 | $1,403 | $15,808 | $0 | $0 |
| 2022 | $1,379 | $15,808 | $0 | $0 |
| 2021 | $1,379 | $15,808 | $0 | $0 |
| 2020 | $1,379 | $15,808 | $0 | $0 |
| 2019 | $1,248 | $14,203 | $0 | $0 |
| 2018 | $1,219 | $14,203 | $0 | $0 |
| 2017 | $1,219 | $14,203 | $0 | $0 |
| 2016 | $999 | $13,971 | $0 | $0 |
| 2015 | $999 | $13,971 | $0 | $0 |
| 2014 | $969 | $13,971 | $0 | $0 |
| 2013 | -- | $13,971 | $0 | $0 |
Source: Public Records
Map
Nearby Homes
- 114 Sara Fox Dr
- 101 Sandstone Dr
- 250 John Martin Dr
- 322 Red Cedar Dr
- 328 Red Cedar Dr
- 306 Red Cedar Dr
- 913 Caitlin Cove
- 108 Holly Bush Place
- 102 Dogwood Trail
- 000 Holly Bush Rd
- 504 Kate Lofton Dr
- 12 Holmar Dr
- 812 Jason Cove
- 168 Blackstone Cir
- 918 Frisky Dr
- 117 Hollybush Place
- 108 Holly Bush Rd
- 115 Crossview Place
- 127 Crossview Place
- 981 Holly Bush Rd
- 143 Appleridge Dr
- 145 Appleridge Dr
- 141 Appleridge Dr
- 325 Cherry Bark Dr
- 147 Appleridge Dr
- 139 Appleridge Dr
- 323 Cherry Bark Dr
- 327 Cherry Bark Dr
- 144 Appleridge Dr
- 140 Appleridge Dr
- 149 Appleridge Dr
- 321 Cherry Bark Dr
- 137 Appleridge Dr
- 146 Appleridge Dr
- 138 Appleridge Dr
- 319 Cherry Bark Dr
- 135 Appleridge Dr
- 151 Appleridge Dr
- 151 Appleridge Dr
- 148 Appleridge Dr
Your Personal Tour Guide
Ask me questions while you tour the home.