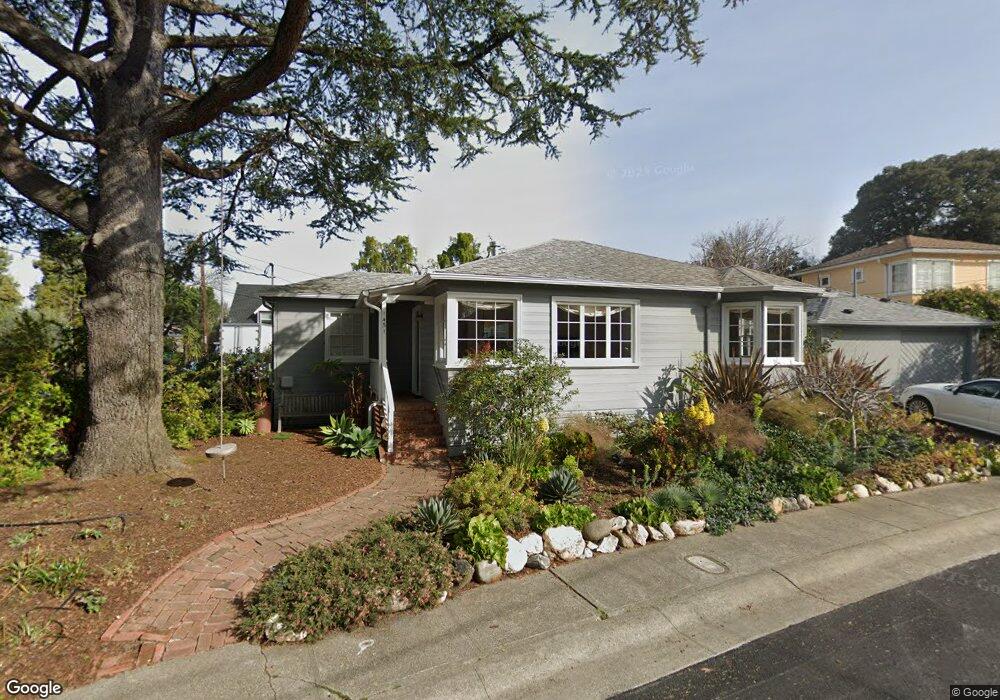
1431 Acton Crescent Berkeley, CA 94702
West Berkeley NeighborhoodEstimated Value: $1,180,000 - $1,510,936
3
Beds
2
Baths
1,182
Sq Ft
$1,102/Sq Ft
Est. Value
About This Home
This home is located at 1431 Acton Crescent, Berkeley, CA 94702 and is currently estimated at $1,302,984, approximately $1,102 per square foot. 1431 Acton Crescent is a home located in Alameda County with nearby schools including Oxford Elementary School, Washington Elementary School, and Berkeley Arts Magnet at Whittier School.
Ownership History
Date
Name
Owned For
Owner Type
Purchase Details
Closed on
Nov 4, 2016
Sold by
Gordon Stacy L
Bought by
Gordon Stacy L and The Stacy L Gordon Revocable I
Current Estimated Value
Purchase Details
Closed on
Apr 23, 2002
Sold by
Vargo Rita L
Bought by
Gordon Stacy L
Home Financials for this Owner
Home Financials are based on the most recent Mortgage that was taken out on this home.
Original Mortgage
$344,000
Outstanding Balance
$145,856
Interest Rate
7.13%
Estimated Equity
$1,157,128
Purchase Details
Closed on
Jul 9, 1997
Sold by
Schwab Edna C and Schwab Donald T
Bought by
Vargo Rita L
Home Financials for this Owner
Home Financials are based on the most recent Mortgage that was taken out on this home.
Original Mortgage
$183,200
Interest Rate
7.83%
Create a Home Valuation Report for This Property
The Home Valuation Report is an in-depth analysis detailing your home's value as well as a comparison with similar homes in the area
Home Values in the Area
Average Home Value in this Area
Purchase History
| Date | Buyer | Sale Price | Title Company |
|---|---|---|---|
| Gordon Stacy L | -- | None Available | |
| Gordon Stacy L | $521,000 | Old Republic Title Company | |
| Vargo Rita L | $229,000 | Old Republic Title Company | |
| Schwab Donald T | -- | Old Republic Title Company |
Source: Public Records
Mortgage History
| Date | Status | Borrower | Loan Amount |
|---|---|---|---|
| Open | Gordon Stacy L | $344,000 | |
| Previous Owner | Vargo Rita L | $183,200 |
Source: Public Records
Tax History
| Year | Tax Paid | Tax Assessment Tax Assessment Total Assessment is a certain percentage of the fair market value that is determined by local assessors to be the total taxable value of land and additions on the property. | Land | Improvement |
|---|---|---|---|---|
| 2025 | $12,941 | $859,296 | $230,886 | $635,410 |
| 2024 | $12,941 | $842,312 | $226,359 | $622,953 |
| 2023 | $12,612 | $832,663 | $221,922 | $610,741 |
| 2022 | $12,173 | $803,237 | $217,571 | $592,666 |
| 2021 | $11,238 | $704,018 | $213,305 | $497,713 |
| 2020 | $10,239 | $703,730 | $211,119 | $492,611 |
| 2019 | $9,914 | $689,933 | $206,980 | $482,953 |
| 2018 | $9,756 | $676,408 | $202,922 | $473,486 |
| 2017 | $9,406 | $663,148 | $198,944 | $464,204 |
| 2016 | $9,149 | $650,150 | $195,045 | $455,105 |
| 2015 | $9,031 | $640,387 | $192,116 | $448,271 |
| 2014 | $8,460 | $586,000 | $175,800 | $410,200 |
Source: Public Records
Map
Nearby Homes
- 2118 California St
- 2350 Sacramento St
- 1411 Hearst Ave Unit 2
- 1813 Sacramento St
- 1436 Delaware St
- 2144 Curtis St
- 2324 Browning St
- 1261 Hearst Ave
- 1919 Curtis St
- 2231 Byron St
- 2218 -2222 Grant St
- 1645 Dwight Way
- 1322 Virginia St
- 1207 Francisco St
- 1207 Francisco St Unit 2
- 1728 Curtis St
- 1128 Delaware St
- 1142 Dwight Way
- 2327 10th St Unit 4
- 1039 Channing Way
- 4 Acton Cir
- 0 Acton Cir
- 1441 Acton Crescent
- 2 Acton Cir
- 6 Acton Cir
- 1430 Acton Crescent
- 1440 Acton Crescent
- 7 Acton Cir
- 3 Acton Cir
- 7, 9 &11 Acton Cir
- 1461 Acton Crescent
- 1450 Acton Crescent
- 5 Acton Cir
- 1420 Acton Crescent
- 1411 Acton Crescent
- 2155 Acton St
- 2163 Acton St
- 1471 Acton Crescent
- 2131 Acton St
- 1470 Acton Crescent
Your Personal Tour Guide
Ask me questions while you tour the home.