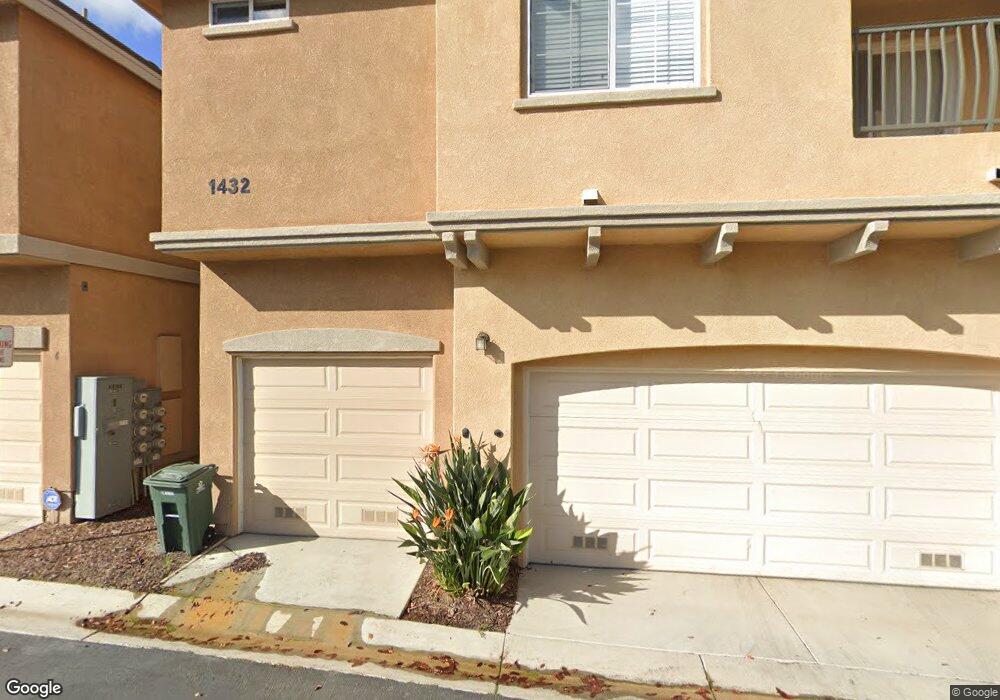
1432 Water Lily Dr Unit 1 Chula Vista, CA 91913
Otay Ranch NeighborhoodEstimated Value: $551,758 - $596,000
2
Beds
2
Baths
1,008
Sq Ft
$575/Sq Ft
Est. Value
About This Home
This home is located at 1432 Water Lily Dr Unit 1, Chula Vista, CA 91913 and is currently estimated at $579,440, approximately $574 per square foot. 1432 Water Lily Dr Unit 1 is a home located in San Diego County with nearby schools including Veterans Elementary School, Rancho Del Rey Middle School, and Olympian High School.
Ownership History
Date
Name
Owned For
Owner Type
Purchase Details
Closed on
Oct 30, 2018
Sold by
Devera Melanie
Bought by
Many S Properties Llc
Current Estimated Value
Purchase Details
Closed on
Jun 19, 2014
Sold by
Taitano Steven Jorge
Bought by
Devera Melanie
Home Financials for this Owner
Home Financials are based on the most recent Mortgage that was taken out on this home.
Original Mortgage
$256,500
Interest Rate
4.12%
Mortgage Type
New Conventional
Purchase Details
Closed on
Aug 30, 2011
Sold by
Otay Ranch Vi 2 Llc
Bought by
Taitano Steven Jorge
Home Financials for this Owner
Home Financials are based on the most recent Mortgage that was taken out on this home.
Original Mortgage
$190,890
Interest Rate
4.26%
Mortgage Type
FHA
Create a Home Valuation Report for This Property
The Home Valuation Report is an in-depth analysis detailing your home's value as well as a comparison with similar homes in the area
Home Values in the Area
Average Home Value in this Area
Purchase History
| Date | Buyer | Sale Price | Title Company |
|---|---|---|---|
| Many S Properties Llc | $352,000 | First American Title | |
| Devera Melanie | -- | First American Title | |
| Devera Melanie | $270,000 | Chicago Title Company | |
| Taitano Steven Jorge | $210,000 | Fidelity National Title |
Source: Public Records
Mortgage History
| Date | Status | Borrower | Loan Amount |
|---|---|---|---|
| Previous Owner | Devera Melanie | $256,500 | |
| Previous Owner | Taitano Steven Jorge | $190,890 |
Source: Public Records
Tax History Compared to Growth
Tax History
| Year | Tax Paid | Tax Assessment Tax Assessment Total Assessment is a certain percentage of the fair market value that is determined by local assessors to be the total taxable value of land and additions on the property. | Land | Improvement |
|---|---|---|---|---|
| 2025 | $6,375 | $392,657 | $192,587 | $200,070 |
| 2024 | $6,375 | $384,959 | $188,811 | $196,148 |
| 2023 | $6,423 | $377,411 | $185,109 | $192,302 |
| 2022 | $6,258 | $370,012 | $181,480 | $188,532 |
| 2021 | $6,112 | $362,758 | $177,922 | $184,836 |
| 2020 | $5,991 | $359,039 | $176,098 | $182,941 |
| 2019 | $5,862 | $352,000 | $172,646 | $179,354 |
| 2018 | $5,192 | $285,188 | $139,877 | $145,311 |
| 2017 | $13 | $279,597 | $137,135 | $142,462 |
| 2016 | $4,964 | $274,116 | $134,447 | $139,669 |
| 2015 | $4,869 | $270,000 | $132,428 | $137,572 |
| 2014 | $4,108 | $215,171 | $105,536 | $109,635 |
Source: Public Records
Map
Nearby Homes
- 1459 Sutter Buttes St
- 1440 Levant Ln Unit 1
- 1448 Water Lily Dr Unit 1
- 1433 Vallejo Mills St Unit 1
- 1915 Caminito de la Cruz
- 1452 Canvas Dr Unit 1
- 1875 Baudouin Place Unit 1731
- 1338 Nicolette Ave Unit 1033
- 1450 Suwerte Ave
- 2040 Mindoro Ln Unit 4
- 1548 Hunters Glen Ave
- 1405 Sulu Sea Ln Unit 4
- 1295 Haglar Way Unit 1
- 0 Towncenter Lot#30
- 0 Towncenter Lot#33
- 0 Towncenter Lot#34
- 0 Towncenter Lot#3
- 1284 Haglar Way Unit 1
- 1280 Haglar Way Unit 2
- 1873 Fargo Ln Unit 4
- 1434 Claude Ln Unit 5
- 1432 Water Lily Dr Unit 4
- 1434 Claude Ln
- 1432 Water Lily Dr
- 1434 Claude Ln Unit 3
- 1434 Claude Ln Unit 2
- 1432 Water Lily Dr Unit 2
- 1432 Water Lily Dr Unit 5
- 1434 Claude Ln Unit 1
- 1434 Claude Ln Unit 4
- 1432 Water Lily Dr Unit 6
- 1432 Claude Ln Unit 6
- 1424 Water Lily Dr Unit 255
- 1424 Water Lily Dr Unit 3
- 1424 Water Lily Dr Unit 1
- 1430 Trouville Ln Unit 3
- 1430 Trouville Ln Unit 1
- 1430 Trouville Ln Unit 223
- 1430 Trouville Ln
- 1430 Trouville Ln Unit 6