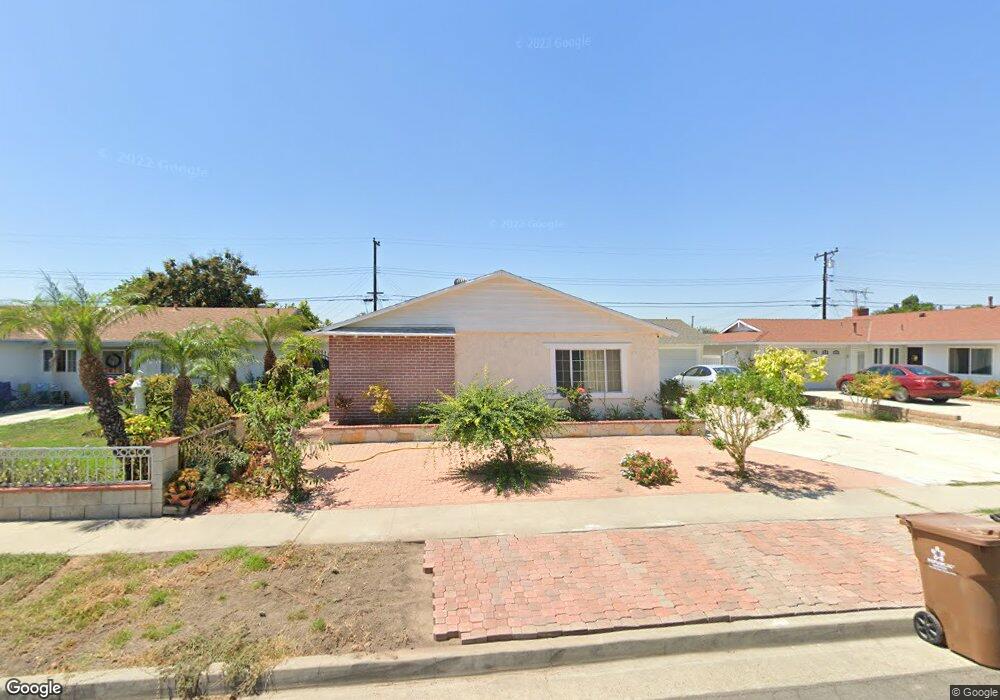
14321 Hope St Garden Grove, CA 92843
Little Saigon NeighborhoodEstimated Value: $977,000 - $1,088,000
3
Beds
2
Baths
1,891
Sq Ft
$547/Sq Ft
Est. Value
About This Home
This home is located at 14321 Hope St, Garden Grove, CA 92843 and is currently estimated at $1,034,370, approximately $546 per square foot. 14321 Hope St is a home located in Orange County with nearby schools including Morningside Elementary School, James Irvine Intermediate School, and Bolsa Grande High School.
Ownership History
Date
Name
Owned For
Owner Type
Purchase Details
Closed on
Dec 8, 2017
Sold by
Tran Quoc Minh and Bach Chiem Lien T
Bought by
Tran Van Quoc
Current Estimated Value
Purchase Details
Closed on
Nov 4, 2001
Sold by
Tran Quoc Minh and Chiem Lien T Bach
Bought by
Tran Quoc Minh and Chiem Lien T Bach
Purchase Details
Closed on
Oct 20, 1994
Sold by
Redlands Federal Bank
Bought by
Tran Nu Ngoc and Chiem Lien Bach T
Home Financials for this Owner
Home Financials are based on the most recent Mortgage that was taken out on this home.
Original Mortgage
$146,700
Interest Rate
8.7%
Purchase Details
Closed on
Mar 25, 1994
Sold by
Redlands Financial Services Inc
Bought by
Redlands Federal Bank and Redlands Fsla
Purchase Details
Closed on
Oct 25, 1993
Sold by
U S W International Investments Inc
Bought by
Orange Townhomes Inc
Purchase Details
Closed on
Sep 20, 1993
Sold by
Nguyen Francis and Nguyen Kim
Bought by
Usw International Investments Inc
Create a Home Valuation Report for This Property
The Home Valuation Report is an in-depth analysis detailing your home's value as well as a comparison with similar homes in the area
Home Values in the Area
Average Home Value in this Area
Purchase History
| Date | Buyer | Sale Price | Title Company |
|---|---|---|---|
| Tran Van Quoc | -- | None Available | |
| Tran Quoc Minh | -- | -- | |
| Tran Nu Ngoc | $163,000 | Fidelity National Title Ins | |
| Redlands Federal Bank | $146,029 | Fidelity National Title Ins | |
| Orange Townhomes Inc | -- | -- | |
| Usw International Investments Inc | -- | -- |
Source: Public Records
Mortgage History
| Date | Status | Borrower | Loan Amount |
|---|---|---|---|
| Closed | Tran Nu Ngoc | $146,700 |
Source: Public Records
Tax History Compared to Growth
Tax History
| Year | Tax Paid | Tax Assessment Tax Assessment Total Assessment is a certain percentage of the fair market value that is determined by local assessors to be the total taxable value of land and additions on the property. | Land | Improvement |
|---|---|---|---|---|
| 2025 | $3,592 | $273,778 | $168,395 | $105,383 |
| 2024 | $3,592 | $268,410 | $165,093 | $103,317 |
| 2023 | $3,524 | $263,148 | $161,856 | $101,292 |
| 2022 | $3,448 | $257,989 | $158,683 | $99,306 |
| 2021 | $3,412 | $252,931 | $155,572 | $97,359 |
| 2020 | $3,367 | $250,338 | $153,977 | $96,361 |
| 2019 | $3,306 | $245,430 | $150,958 | $94,472 |
| 2018 | $3,242 | $240,618 | $147,998 | $92,620 |
| 2017 | $3,115 | $235,900 | $145,096 | $90,804 |
| 2016 | $2,966 | $231,275 | $142,251 | $89,024 |
| 2015 | $2,924 | $227,802 | $140,115 | $87,687 |
| 2014 | $2,853 | $223,340 | $137,370 | $85,970 |
Source: Public Records
Map
Nearby Homes
- 14171 Flower St
- 10061 15th St
- 9906 13th St
- 9884 11th St
- 14151 Lake St
- 14356 Taft St
- 9936 Pear Dr
- 10886 Lotus Dr
- 9851 Bolsa Ave Unit 198
- 9851 Bolsa Ave Unit 196
- 14362 Bushard St Unit 39
- 14362 Bushard St Unit 109
- 5317 Silver Dr
- 13322 Euclid St
- 5405 W 4th St
- 812 N Euclid St
- 14376 Euclid St Unit 1-4
- 9800 Bolsa Ave Unit 14
- 10632 Henderson Ave
- 13611 Glenhaven Dr
- 14311 Hope St
- 14331 Hope St
- 14322 Harrington St
- 14312 Harrington St
- 14332 Harrington St
- 14301 Hope St
- 14341 Hope St
- 14302 Harrington St
- 14342 Harrington St
- 14322 Hope St
- 14312 Hope St
- 14332 Hope St
- 14351 Hope St
- 10192 Jennrich Ave
- 14302 Hope St
- 14342 Hope St
- 14352 Harrington St
- 10172 Jennrich Ave
- 14361 Hope St
- 14352 Hope St