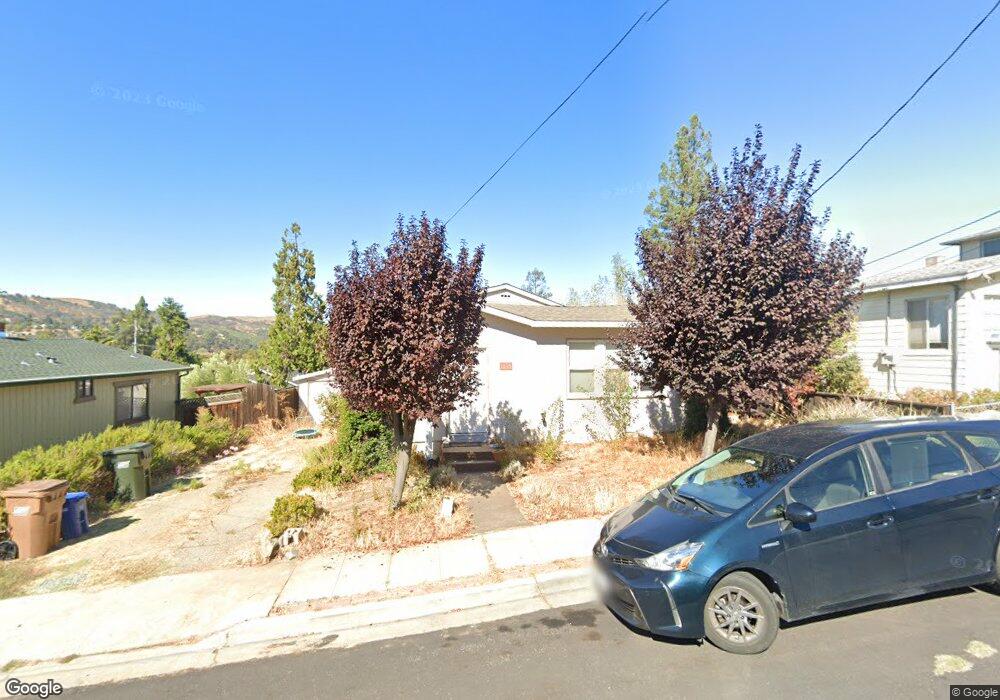
1435 Cedar St Martinez, CA 94553
Estimated Value: $546,000 - $563,000
2
Beds
1
Bath
1,060
Sq Ft
$524/Sq Ft
Est. Value
About This Home
This home is located at 1435 Cedar St, Martinez, CA 94553 and is currently estimated at $555,225, approximately $523 per square foot. 1435 Cedar St is a home located in Contra Costa County with nearby schools including Las Juntas Elementary School, Martinez Junior High School, and Alhambra Senior High School.
Ownership History
Date
Name
Owned For
Owner Type
Purchase Details
Closed on
Mar 25, 2016
Sold by
Morgan Bruce
Bought by
Said James M and Haug Said Jenna L
Current Estimated Value
Home Financials for this Owner
Home Financials are based on the most recent Mortgage that was taken out on this home.
Original Mortgage
$355,894
Outstanding Balance
$279,368
Interest Rate
3.65%
Mortgage Type
New Conventional
Estimated Equity
$275,857
Purchase Details
Closed on
Jul 21, 2003
Sold by
Kennerley Cary M
Bought by
Morgan Bruce
Home Financials for this Owner
Home Financials are based on the most recent Mortgage that was taken out on this home.
Original Mortgage
$205,000
Interest Rate
4.62%
Mortgage Type
Negative Amortization
Purchase Details
Closed on
Mar 7, 2002
Sold by
Kennerley Cary M
Bought by
Kennerley Cary M
Purchase Details
Closed on
Aug 30, 1999
Sold by
Brown Marcia L and Brown Marcia L
Bought by
Kennerley Marcia L
Create a Home Valuation Report for This Property
The Home Valuation Report is an in-depth analysis detailing your home's value as well as a comparison with similar homes in the area
Home Values in the Area
Average Home Value in this Area
Purchase History
We collect this data history from publicly available records. To have your information removed, we recommend requesting removal directly through your county’s website.
| Date | Buyer | Sale Price | Title Company |
|---|---|---|---|
| Said James M | $385,000 | Old Republic Title Company | |
| Morgan Bruce | $315,000 | Chicago Title | |
| Kennerley Cary M | -- | -- | |
| Kennerley Marcia L | -- | -- |
Source: Public Records
Mortgage History
We collect this data history from publicly available records. To have your information removed, we recommend requesting removal directly through your county’s website.
| Date | Status | Borrower | Loan Amount |
|---|---|---|---|
| Open | Said James M | $355,894 | |
| Previous Owner | Morgan Bruce | $205,000 |
Source: Public Records
Tax History
| Year | Tax Paid | Tax Assessment Tax Assessment Total Assessment is a certain percentage of the fair market value that is determined by local assessors to be the total taxable value of land and additions on the property. | Land | Improvement |
|---|---|---|---|---|
| 2025 | $6,306 | $455,400 | $337,023 | $118,377 |
| 2024 | $6,032 | $446,471 | $330,415 | $116,056 |
| 2023 | $5,924 | $437,718 | $323,937 | $113,781 |
| 2022 | $5,829 | $429,136 | $317,586 | $111,550 |
| 2021 | $5,663 | $420,722 | $311,359 | $109,363 |
| 2019 | $5,491 | $408,245 | $302,125 | $106,120 |
| 2018 | $5,321 | $400,241 | $296,201 | $104,040 |
| 2017 | $5,233 | $392,394 | $290,394 | $102,000 |
| 2016 | $4,044 | $310,000 | $241,114 | $68,886 |
| 2015 | $3,749 | $283,500 | $220,502 | $62,998 |
| 2014 | $3,572 | $268,500 | $208,836 | $59,664 |
Source: Public Records
Map
Nearby Homes
- 1435 Date St
- 2214 Pacheco Blvd
- 2205 Scenic Ave
- 2220 S Crest Ave
- 2131 Pomona Ave
- 2280 N Crest Ave
- 1940 Pine St
- 1050 Sierra Ave
- 2266 Monterey Ave
- 1121 Haven St
- 811 Brown St
- 2350 W Shell Ave
- 1404 Pine St
- 1370 Vine Ave
- 1716 Estudillo St
- 2027 Castro St
- 2405 Griffanti Ct
- 2547 Bella Vista Ave
- 855 Bella Vista Ave
- 1724 Alhambra Ave
- 2009 Pacheco Blvd Unit A
- 2009 Pacheco Blvd
- 2005 Pacheco Blvd
- 2015 Pacheco Blvd
- 1420 Beech St
- 2035 Pacheco Blvd
- 1424 Beech St
- 1423 Cedar St
- 1436 Beech St
- 1935 Pacheco Blvd
- 2010 Pacheco Blvd
- 2000 Pacheco Blvd
- 2030 Pacheco Blvd
- 1446 Beech St
- 1445 Cedar St
- 1425 Beech St
- 2032 Pacheco Blvd
- 2101 Pacheco Blvd
- 1970 Pacheco Blvd
- 1435 Beech St
Your Personal Tour Guide
Ask me questions while you tour the home.