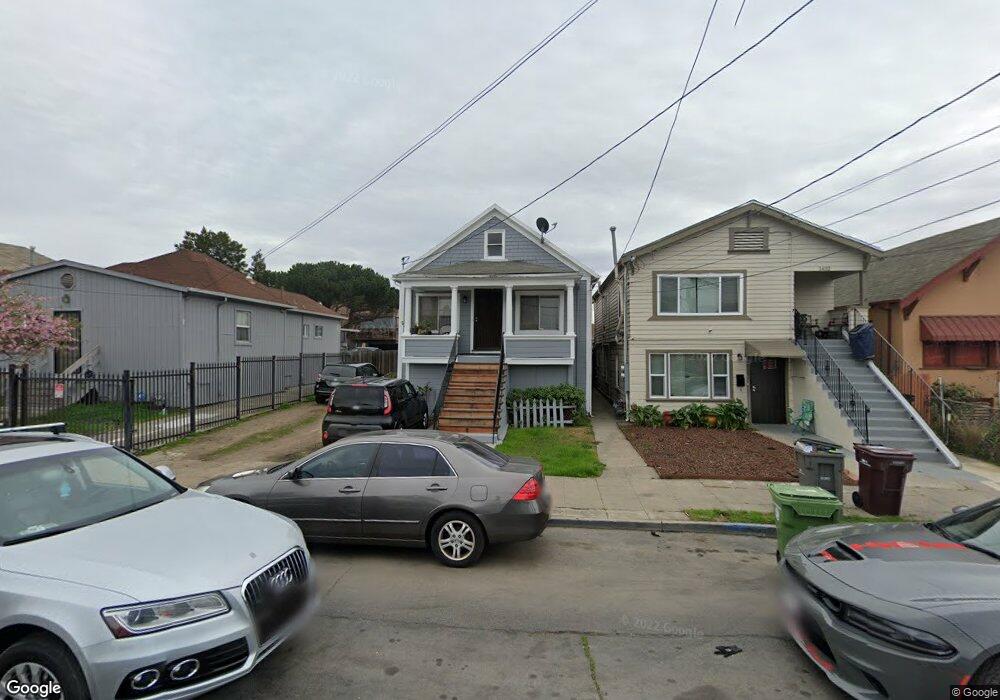
1436 48th Ave Oakland, CA 94601
Fremont NeighborhoodEstimated Value: $418,000 - $521,000
3
Beds
1
Bath
1,034
Sq Ft
$441/Sq Ft
Est. Value
About This Home
This home is located at 1436 48th Ave, Oakland, CA 94601 and is currently estimated at $455,673, approximately $440 per square foot. 1436 48th Ave is a home located in Alameda County with nearby schools including Bridges Academy Elementary School, Greenleaf TK-8, and Coliseum College Prep Academy.
Ownership History
Date
Name
Owned For
Owner Type
Purchase Details
Closed on
Aug 28, 2018
Sold by
Dela Cruz Julian F
Bought by
Dela Cruz Julian Felix and De La Cruz Living Trust
Current Estimated Value
Purchase Details
Closed on
Aug 4, 2014
Sold by
Dela Cruz Mario R
Bought by
Revoca Dela Cruz Mario R and Revoca Mario R De La Crus 2014
Purchase Details
Closed on
Aug 4, 2003
Sold by
Delacruz Julian F and Jose J Delacruz Living Trust
Bought by
Delacruz Julian F and Delacruz John J
Purchase Details
Closed on
Oct 3, 2000
Sold by
Delacruz Jose J
Bought by
Delacruz Jose J and Jose J Delacruz Revocable Trus
Create a Home Valuation Report for This Property
The Home Valuation Report is an in-depth analysis detailing your home's value as well as a comparison with similar homes in the area
Home Values in the Area
Average Home Value in this Area
Purchase History
| Date | Buyer | Sale Price | Title Company |
|---|---|---|---|
| Dela Cruz Julian Felix | -- | None Available | |
| Revoca Dela Cruz Mario R | -- | None Available | |
| Delacruz Julian F | -- | -- | |
| Delacruz Jose J | -- | -- |
Source: Public Records
Tax History Compared to Growth
Tax History
| Year | Tax Paid | Tax Assessment Tax Assessment Total Assessment is a certain percentage of the fair market value that is determined by local assessors to be the total taxable value of land and additions on the property. | Land | Improvement |
|---|---|---|---|---|
| 2025 | $980 | $37,376 | $27,950 | $16,426 |
| 2024 | $980 | $36,506 | $27,402 | $16,104 |
| 2023 | $1,116 | $42,654 | $26,865 | $15,789 |
| 2022 | $957 | $34,817 | $26,338 | $15,479 |
| 2021 | $942 | $33,998 | $25,822 | $15,176 |
| 2020 | $928 | $40,577 | $25,557 | $15,020 |
| 2019 | $907 | $39,782 | $25,056 | $14,726 |
| 2018 | $1,273 | $39,002 | $24,565 | $14,437 |
| 2017 | $1,166 | $38,237 | $24,083 | $14,154 |
| 2016 | $1,445 | $37,487 | $23,611 | $13,876 |
| 2015 | $1,448 | $36,924 | $23,256 | $13,668 |
| 2014 | $1,366 | $36,201 | $22,801 | $13,400 |
Source: Public Records
Map
Nearby Homes