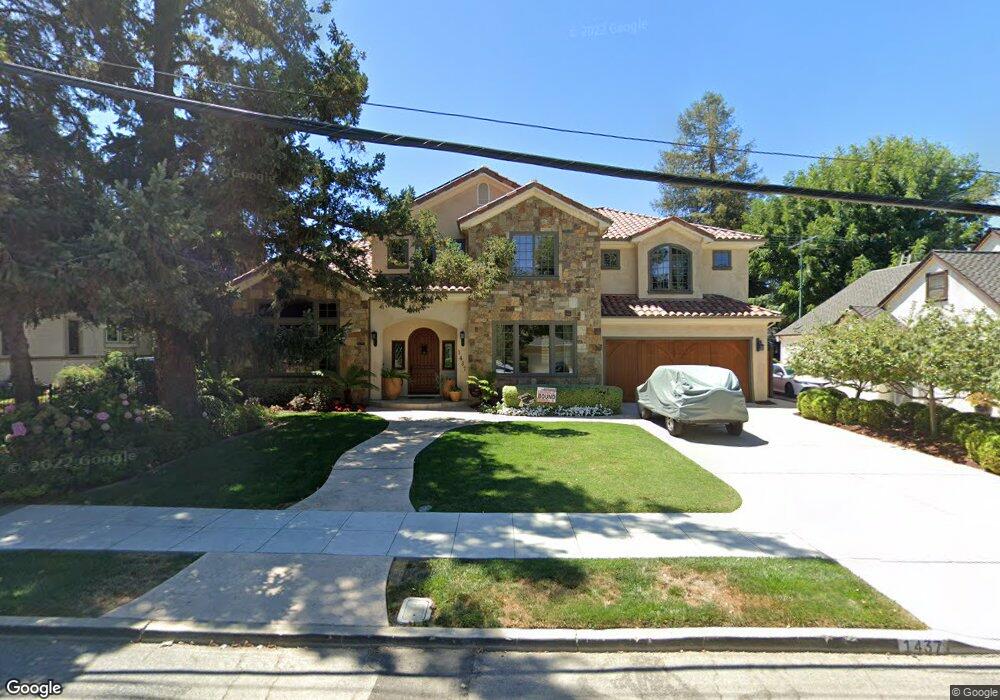
1437 Lupton Ave San Jose, CA 95125
Willow Glen NeighborhoodEstimated Value: $2,093,000 - $4,314,000
3
Beds
2
Baths
1,296
Sq Ft
$2,820/Sq Ft
Est. Value
About This Home
This home is located at 1437 Lupton Ave, San Jose, CA 95125 and is currently estimated at $3,654,197, approximately $2,819 per square foot. 1437 Lupton Ave is a home located in Santa Clara County with nearby schools including Willow Glen Elementary, Willow Glen Middle, and Willow Glen High School.
Ownership History
Date
Name
Owned For
Owner Type
Purchase Details
Closed on
Dec 27, 2012
Sold by
Robbins William T and Robbins Christine L
Bought by
Robbins William T and Robins Christine L
Current Estimated Value
Home Financials for this Owner
Home Financials are based on the most recent Mortgage that was taken out on this home.
Original Mortgage
$415,500
Outstanding Balance
$282,056
Interest Rate
2.87%
Mortgage Type
New Conventional
Estimated Equity
$3,372,141
Purchase Details
Closed on
Jan 21, 2011
Sold by
Robbins William T and Robbins Christine L
Bought by
Robbins William T and Robbins Christine L
Home Financials for this Owner
Home Financials are based on the most recent Mortgage that was taken out on this home.
Original Mortgage
$697,000
Outstanding Balance
$459,942
Interest Rate
4.12%
Mortgage Type
New Conventional
Estimated Equity
$3,194,255
Purchase Details
Closed on
Jun 23, 2009
Sold by
Rock Richard and Rock Michelle
Bought by
Robbins William T and Robbins Christine L
Home Financials for this Owner
Home Financials are based on the most recent Mortgage that was taken out on this home.
Original Mortgage
$735,000
Interest Rate
4.83%
Mortgage Type
Purchase Money Mortgage
Purchase Details
Closed on
Jan 29, 2008
Sold by
Rock Richard James and Rock Michelle
Bought by
Rock Richard and Rock Michelle
Home Financials for this Owner
Home Financials are based on the most recent Mortgage that was taken out on this home.
Original Mortgage
$136,800
Interest Rate
6.09%
Mortgage Type
Credit Line Revolving
Purchase Details
Closed on
Jan 25, 2008
Sold by
Morgan Michael J and Morgan Xiomara M
Bought by
Rock Richard James and Rock Micelle
Home Financials for this Owner
Home Financials are based on the most recent Mortgage that was taken out on this home.
Original Mortgage
$136,800
Interest Rate
6.09%
Mortgage Type
Credit Line Revolving
Purchase Details
Closed on
Nov 1, 2007
Sold by
Morgan Michael J
Bought by
Morgan Michael J and Morgan Xiomara M
Purchase Details
Closed on
Jan 7, 2005
Sold by
Morgan Xiomara M
Bought by
Morgan Michael J
Home Financials for this Owner
Home Financials are based on the most recent Mortgage that was taken out on this home.
Original Mortgage
$200,000
Interest Rate
5.69%
Mortgage Type
Credit Line Revolving
Purchase Details
Closed on
Jul 25, 2002
Sold by
Morgan Michael J
Bought by
Mauldwin David M
Create a Home Valuation Report for This Property
The Home Valuation Report is an in-depth analysis detailing your home's value as well as a comparison with similar homes in the area
Home Values in the Area
Average Home Value in this Area
Purchase History
| Date | Buyer | Sale Price | Title Company |
|---|---|---|---|
| Robbins William T | -- | First American Title Company | |
| Robbins William T | -- | First American Title Company | |
| Robbins William T | -- | Old Republic Title Company | |
| Robbins William T | -- | Old Republic Title Company | |
| Robbins William T | -- | Old Republic Title Company | |
| Rock Richard | -- | Financial Title Company | |
| Rock Richard James | $1,570,000 | Financial Title Company | |
| Morgan Michael J | -- | None Available | |
| Morgan Michael J | -- | Commonwealth Land Title | |
| Morgan Michael J | -- | Commonwealth Land Title | |
| Mauldwin David M | -- | -- |
Source: Public Records
Mortgage History
| Date | Status | Borrower | Loan Amount |
|---|---|---|---|
| Open | Robbins William T | $415,500 | |
| Open | Robbins William T | $697,000 | |
| Closed | Robbins William T | $735,000 | |
| Previous Owner | Rock Richard James | $136,800 | |
| Previous Owner | Morgan Michael J | $200,000 | |
| Previous Owner | Morgan Michael J | $150,000 |
Source: Public Records
Tax History
| Year | Tax Paid | Tax Assessment Tax Assessment Total Assessment is a certain percentage of the fair market value that is determined by local assessors to be the total taxable value of land and additions on the property. | Land | Improvement |
|---|---|---|---|---|
| 2025 | $33,352 | $2,759,005 | $1,629,015 | $1,129,990 |
| 2024 | $33,352 | $2,704,908 | $1,597,074 | $1,107,834 |
| 2023 | $32,790 | $2,651,871 | $1,565,759 | $1,086,112 |
| 2022 | $32,479 | $2,599,874 | $1,535,058 | $1,064,816 |
| 2021 | $31,898 | $2,548,897 | $1,504,959 | $1,043,938 |
| 2020 | $31,211 | $2,522,762 | $1,489,528 | $1,033,234 |
| 2019 | $30,569 | $2,473,297 | $1,460,322 | $1,012,975 |
| 2018 | $30,296 | $2,424,802 | $1,431,689 | $993,113 |
| 2017 | $30,078 | $2,377,258 | $1,403,617 | $973,641 |
| 2016 | $29,763 | $2,330,646 | $1,376,096 | $954,550 |
| 2015 | $29,607 | $2,295,638 | $1,355,426 | $940,212 |
| 2014 | $28,606 | $2,250,671 | $1,328,876 | $921,795 |
Source: Public Records
Map
Nearby Homes
- 1335 Glenwood Ave
- 1224 Glenwood Ave
- 1169 Minnesota Ave Unit 1
- 1140 Glenmeadow Ct
- 1248 Camino Pablo
- 1736 Wilcox Way
- 1141 Dean Ave
- 1512 Minnesota Ave
- 1538 Lincoln Ave
- 1192 Crescent Dr
- 1197 Willow St
- 1549 Keesling Ave
- 1715 Sandy Creek Ln
- 1127 Norval Way
- 1162 Crescent Dr
- 1823 Lincoln Ave
- 1013 Camino Pablo
- 1641 Isabel Dr
- 1490 Curtiss Ave
- 1109 Garfield Ave
- 1443 Lupton Ave
- 1425 Lupton Ave
- 1408 Hotspur Ct
- 1417 Lupton Ave
- 1455 Lupton Ave
- 1406 Hotspur Ct
- 1232 Minnesota Ave
- 1236 Minnesota Ave
- 1436 Lupton Ave
- 1226 Minnesota Ave
- 1440 Lupton Ave
- 1242 Minnesota Ave Unit B
- 1242 Minnesota Ave Unit A
- 1242 Minnesota Ave Unit C
- 1242 Minnesota Ave
- 1242 Minnesota Ave
- 1242 Minnesota Ave
- 1446 Cherry Ave
- 1238 Minnesota Ave
- 1426 Lupton Ave
Your Personal Tour Guide
Ask me questions while you tour the home.