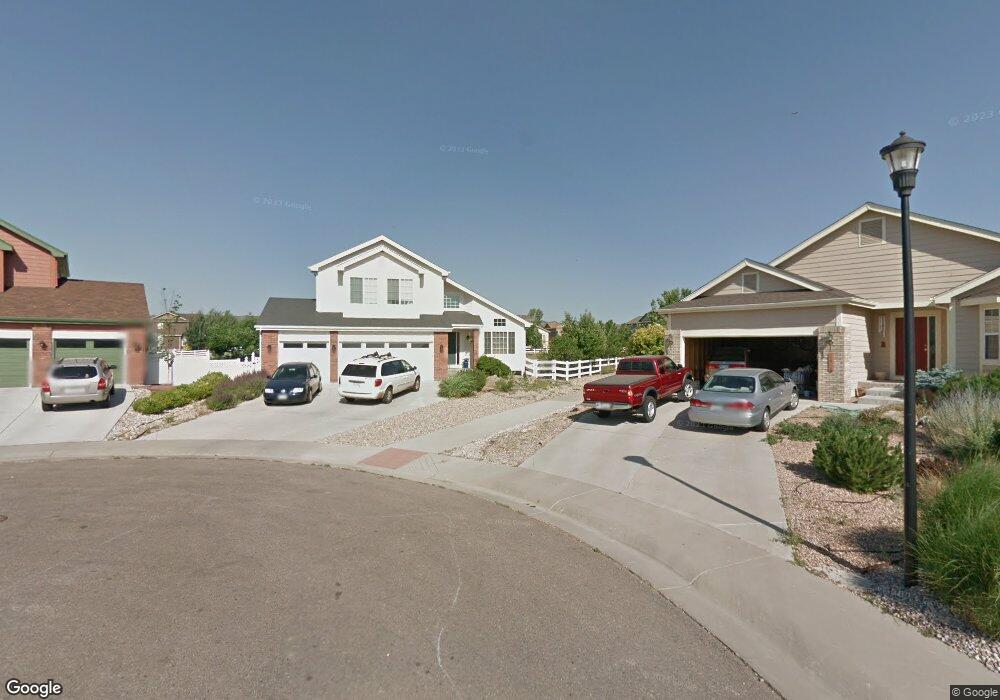
1438 Curtiss Ct Fort Collins, CO 80526
Registry Ridge NeighborhoodEstimated Value: $672,917 - $796,000
4
Beds
4
Baths
3,692
Sq Ft
$202/Sq Ft
Est. Value
About This Home
This home is located at 1438 Curtiss Ct, Fort Collins, CO 80526 and is currently estimated at $745,979, approximately $202 per square foot. 1438 Curtiss Ct is a home located in Larimer County with nearby schools including Coyote Ridge Elementary School, Lucile Erwin Middle School, and Loveland High School.
Ownership History
Date
Name
Owned For
Owner Type
Purchase Details
Closed on
Oct 1, 2024
Sold by
Larson James G A and Larson Jodi L
Bought by
Jodi L Larson Living Trust
Current Estimated Value
Purchase Details
Closed on
Jul 15, 2011
Sold by
Carpenter Nickalis L and Carpenter Sara A
Bought by
Larson James G A and Larson Jodi L
Home Financials for this Owner
Home Financials are based on the most recent Mortgage that was taken out on this home.
Original Mortgage
$225,000
Interest Rate
4.55%
Mortgage Type
New Conventional
Purchase Details
Closed on
Jun 27, 2007
Sold by
Karim Selina and Nazmul Karim M
Bought by
Carpenter Nickalis L and Carpenter Sara A
Purchase Details
Closed on
Mar 25, 2004
Sold by
Lennar Colorado Llc
Bought by
Karim Selina and Nazmul Karim N
Home Financials for this Owner
Home Financials are based on the most recent Mortgage that was taken out on this home.
Original Mortgage
$230,400
Interest Rate
5.59%
Mortgage Type
Unknown
Create a Home Valuation Report for This Property
The Home Valuation Report is an in-depth analysis detailing your home's value as well as a comparison with similar homes in the area
Home Values in the Area
Average Home Value in this Area
Purchase History
| Date | Buyer | Sale Price | Title Company |
|---|---|---|---|
| Jodi L Larson Living Trust | -- | None Listed On Document | |
| Larson James G A | $345,000 | Fidelity National Title Insu | |
| Carpenter Nickalis L | $341,000 | None Available | |
| Karim Selina | $288,031 | North American Title |
Source: Public Records
Mortgage History
| Date | Status | Borrower | Loan Amount |
|---|---|---|---|
| Previous Owner | Larson James G A | $225,000 | |
| Previous Owner | Karim Selina | $230,400 |
Source: Public Records
Tax History Compared to Growth
Tax History
| Year | Tax Paid | Tax Assessment Tax Assessment Total Assessment is a certain percentage of the fair market value that is determined by local assessors to be the total taxable value of land and additions on the property. | Land | Improvement |
|---|---|---|---|---|
| 2025 | $3,854 | $48,903 | $3,685 | $45,218 |
| 2024 | $3,728 | $48,903 | $3,685 | $45,218 |
| 2022 | $3,051 | $35,842 | $3,823 | $32,019 |
| 2021 | $3,139 | $36,873 | $3,933 | $32,940 |
| 2020 | $3,057 | $35,908 | $3,933 | $31,975 |
| 2019 | $3,008 | $35,908 | $3,933 | $31,975 |
| 2018 | $2,833 | $32,213 | $3,960 | $28,253 |
| 2017 | $2,465 | $32,213 | $3,960 | $28,253 |
| 2016 | $2,421 | $30,646 | $4,378 | $26,268 |
| 2015 | $2,402 | $30,650 | $4,380 | $26,270 |
| 2014 | $2,257 | $27,920 | $4,380 | $23,540 |
Source: Public Records
Map
Nearby Homes
- 7127 Ranger Dr
- 7003 Sculpin Ct
- 7014 Shangri-La Ct
- 1226 Reeves Dr
- 1340 Leahy Dr
- 1232 Meeteetse Ln
- 7321 S Shields St
- 7202 Fort Morgan Dr
- 602 Peyton Dr
- 530 Holyoke Ct
- 7368 New Raymer Ct
- 7421 Triangle Dr
- 7332 Triangle Dr
- 7008 Woodrow Dr
- 320 Strasburg Dr Unit B10
- 402 Hudson Ct
- 225 W Trilby Rd
- 301 Uranus St
- 217 W Trilby Rd
- 120 Triangle Dr
- 1439 Curtiss Ct
- 1432 Curtiss Ct
- 1426 Curtiss Ct
- 1433 Curtiss Ct
- 1503 Wasp Ct
- 1420 Curtiss Ct
- 1502 Wasp Ct
- 1421 Curtiss Ct
- 1433 Snook Ct
- 1502 Sea Wolf Ct
- 1509 Wasp Ct
- 1414 Curtiss Ct
- 1439 Snook Ct
- 1427 Snook Ct
- 7102 Pruitt Ct
- 1415 Curtiss Ct
- 1503 Sea Wolf Ct
- 1509 Tang Ct
- 1508 Sea Wolf Ct
- 1421 Snook Ct