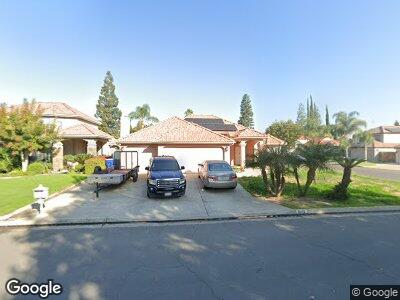
1442 E Omaha Ave Fresno, CA 93720
Woodward Park NeighborhoodEstimated Value: $475,438 - $510,000
3
Beds
2
Baths
1,814
Sq Ft
$274/Sq Ft
Est. Value
About This Home
This home is located at 1442 E Omaha Ave, Fresno, CA 93720 and is currently estimated at $496,360, approximately $273 per square foot. 1442 E Omaha Ave is a home located in Fresno County with nearby schools including Fort Washington Elementary School, Kastner Intermediate School, and Clovis West High School.
Ownership History
Date
Name
Owned For
Owner Type
Purchase Details
Closed on
Jun 7, 2022
Sold by
Fox James L
Bought by
James L Fox Revocable Trust
Current Estimated Value
Purchase Details
Closed on
May 30, 2022
Sold by
James L Fox James L Fox Revocable Trust
Bought by
Willard L Blaylock And Amber C Fox-Blaylock R
Purchase Details
Closed on
Jul 30, 2020
Sold by
Fox Mary E
Bought by
James And Mary Fox Trust and Fox
Purchase Details
Closed on
Jul 2, 2020
Sold by
Fox James L and The James And Mary Fox Trust
Bought by
Fox James L and The James L Fox Revocable Trus
Purchase Details
Closed on
Aug 13, 1998
Sold by
Fox James L and Fox Mary E
Bought by
Fox James L and Fox Mary E
Purchase Details
Closed on
Nov 29, 1993
Sold by
Aviles Maximina
Bought by
Fox James L and Fox Mary E
Home Financials for this Owner
Home Financials are based on the most recent Mortgage that was taken out on this home.
Original Mortgage
$80,000
Interest Rate
7.09%
Create a Home Valuation Report for This Property
The Home Valuation Report is an in-depth analysis detailing your home's value as well as a comparison with similar homes in the area
Home Values in the Area
Average Home Value in this Area
Purchase History
| Date | Buyer | Sale Price | Title Company |
|---|---|---|---|
| Willard L Blaylock And Amber C Fox-Blaylock R | -- | None Listed On Document | |
| Fox James L | -- | None Available | |
| Fox James L | -- | -- | |
| Fox James L | $152,000 | North American Title Co Inc |
Source: Public Records
Mortgage History
| Date | Status | Borrower | Loan Amount |
|---|---|---|---|
| Open | Willard L Blaylock L | $50,000 | |
| Previous Owner | Fox James L | $80,000 |
Source: Public Records
Tax History Compared to Growth
Tax History
| Year | Tax Paid | Tax Assessment Tax Assessment Total Assessment is a certain percentage of the fair market value that is determined by local assessors to be the total taxable value of land and additions on the property. | Land | Improvement |
|---|---|---|---|---|
| 2023 | $5,842 | $484,500 | $153,000 | $331,500 |
| 2022 | $3,031 | $243,430 | $67,258 | $176,172 |
| 2021 | $2,948 | $238,658 | $65,940 | $172,718 |
| 2020 | $2,852 | $236,211 | $65,264 | $170,947 |
| 2019 | $2,796 | $231,581 | $63,985 | $167,596 |
| 2018 | $2,734 | $227,041 | $62,731 | $164,310 |
| 2017 | $2,687 | $222,590 | $61,501 | $161,089 |
| 2016 | $2,597 | $218,227 | $60,296 | $157,931 |
| 2015 | $2,557 | $214,950 | $59,391 | $155,559 |
| 2014 | $2,509 | $210,740 | $58,228 | $152,512 |
Source: Public Records
Map
Nearby Homes
- 1415 E Portland Ave
- 8153 N Cedar Ave Unit 127
- 8153 N Cedar Ave Unit 106
- 8147 N Cedar Ave Unit 203
- 8147 N Cedar Ave Unit 223
- 1526 E Niles Ave
- 8172 N 8th St
- 3052 E Trenton Ave
- 8164 N 8th St
- 1662 E Kenosha Ave
- 1177 E Kenosha Ave
- 8255 N 8th St
- 1801 E Omaha Ave
- 992 E Muncie Ave
- 987 E Portland Ave
- 964 E Omaha Ave
- 968 E Muncie Ave
- 1928 E Portland Ave
- 7728 N 8th St
- 1934 E Omaha Ave
- 1442 E Omaha Ave
- 1430 E Omaha Ave
- 1439 E Portland Ave
- 1427 E Portland Ave
- 1418 E Omaha Ave
- 8278 N Sharon Ave
- 8288 N Sharon Ave
- 1435 E Omaha Ave
- 1447 E Omaha Ave
- 8298 N Sharon Ave
- 1423 E Omaha Ave
- 1459 E Omaha Ave
- 1405 E Portland Ave
- 8308 N Sharon Ave
- 1413 E Omaha Ave
- 1402 E Omaha Ave
- 1440 E Portland Ave
- 1428 E Portland Ave
- 1405 E Omaha Ave
- 1397 E Portland Ave