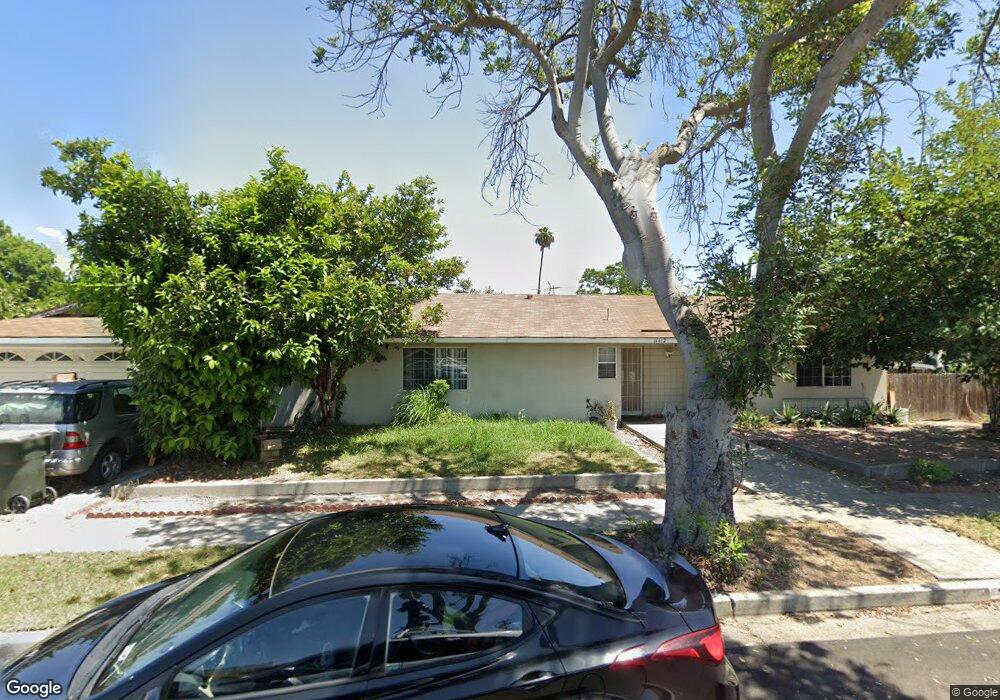
14432 Lyndon St Garden Grove, CA 92843
Little Saigon NeighborhoodEstimated Value: $1,054,000 - $1,291,000
3
Beds
2
Baths
1,781
Sq Ft
$643/Sq Ft
Est. Value
About This Home
This home is located at 14432 Lyndon St, Garden Grove, CA 92843 and is currently estimated at $1,144,346, approximately $642 per square foot. 14432 Lyndon St is a home located in Orange County with nearby schools including Morningside Elementary School, James Irvine Intermediate School, and Bolsa Grande High School.
Ownership History
Date
Name
Owned For
Owner Type
Purchase Details
Closed on
Oct 14, 2011
Sold by
Ismael Hanipha
Bought by
Ismael Hanipha and Sa Ro Phu
Current Estimated Value
Home Financials for this Owner
Home Financials are based on the most recent Mortgage that was taken out on this home.
Original Mortgage
$120,000
Outstanding Balance
$11,379
Interest Rate
4.15%
Mortgage Type
New Conventional
Estimated Equity
$1,132,967
Purchase Details
Closed on
May 9, 2001
Sold by
Ismael Hanipha and Hanipha Ismael
Bought by
Ismael Hanipha
Home Financials for this Owner
Home Financials are based on the most recent Mortgage that was taken out on this home.
Original Mortgage
$215,000
Interest Rate
6.89%
Purchase Details
Closed on
Mar 13, 2000
Sold by
Lee Richard E and Lee Ann Mary
Bought by
Hanipha Ismael
Home Financials for this Owner
Home Financials are based on the most recent Mortgage that was taken out on this home.
Original Mortgage
$210,800
Interest Rate
8.34%
Create a Home Valuation Report for This Property
The Home Valuation Report is an in-depth analysis detailing your home's value as well as a comparison with similar homes in the area
Home Values in the Area
Average Home Value in this Area
Purchase History
| Date | Buyer | Sale Price | Title Company |
|---|---|---|---|
| Ismael Hanipha | -- | First American Title Company | |
| Ismael Hanipha | -- | Lawyers Title Company | |
| Hanipha Ismael | $248,000 | First American Title Ins Co |
Source: Public Records
Mortgage History
| Date | Status | Borrower | Loan Amount |
|---|---|---|---|
| Open | Ismael Hanipha | $120,000 | |
| Closed | Ismael Hanipha | $215,000 | |
| Closed | Hanipha Ismael | $210,800 |
Source: Public Records
Tax History Compared to Growth
Tax History
| Year | Tax Paid | Tax Assessment Tax Assessment Total Assessment is a certain percentage of the fair market value that is determined by local assessors to be the total taxable value of land and additions on the property. | Land | Improvement |
|---|---|---|---|---|
| 2025 | $4,749 | $381,159 | $285,292 | $95,867 |
| 2024 | $4,749 | $373,686 | $279,698 | $93,988 |
| 2023 | $4,659 | $366,359 | $274,213 | $92,146 |
| 2022 | $4,558 | $359,176 | $268,836 | $90,340 |
| 2021 | $4,508 | $352,134 | $263,565 | $88,569 |
| 2020 | $4,448 | $348,524 | $260,863 | $87,661 |
| 2019 | $4,363 | $341,691 | $255,748 | $85,943 |
| 2018 | $4,275 | $334,992 | $250,734 | $84,258 |
| 2017 | $4,215 | $328,424 | $245,818 | $82,606 |
| 2016 | $4,009 | $321,985 | $240,998 | $80,987 |
| 2015 | $3,952 | $317,149 | $237,378 | $79,771 |
| 2014 | $3,856 | $310,937 | $232,728 | $78,209 |
Source: Public Records
Map
Nearby Homes
- 9884 11th St
- 9906 13th St
- 14171 Flower St
- 10061 15th St
- 9936 Pear Dr
- 9851 Bolsa Ave Unit 198
- 9851 Bolsa Ave Unit 196
- 14151 Lake St
- 14362 Bushard St Unit 39
- 14362 Bushard St Unit 109
- 14356 Taft St
- 9800 Bolsa Ave Unit 14
- 10886 Lotus Dr
- 5317 Silver Dr
- 5405 W 4th St
- 10632 Henderson Ave
- 812 N Euclid St
- 13322 Euclid St
- 14376 Euclid St Unit 1-4
- 9175 Sabre Ln
- 10101 Johannah Ave
- 14422 Lyndon St
- 14431 Flower St
- 14421 Flower St
- 14412 Lyndon St
- 14431 Lyndon St
- 14421 Lyndon St
- 14451 Lyndon St
- 10092 Johannah Ave
- 10102 Johannah Ave
- 14411 Flower St
- 14411 Lyndon St
- 14461 Lyndon St
- 10112 Johannah Ave
- 14392 Lyndon St
- 14391 Lyndon St
- 14391 Flower St
- 14471 Lyndon St
- 10122 Johannah Ave
- 14432 Flower St