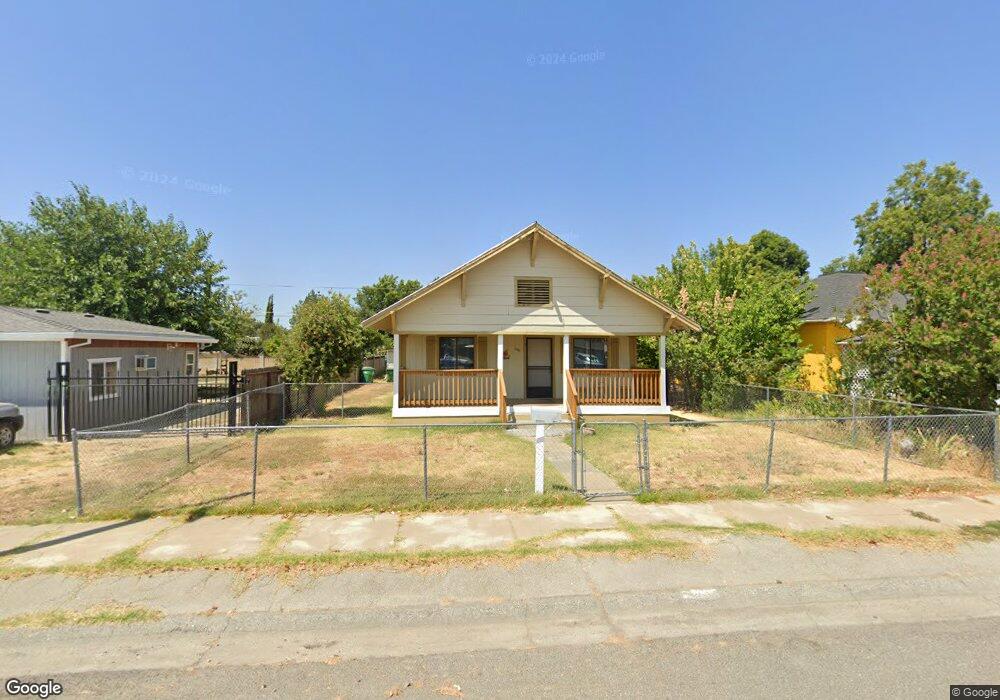
1448 5th Ave Corning, CA 96021
Estimated Value: $188,000 - $245,000
3
Beds
1
Bath
1,352
Sq Ft
$159/Sq Ft
Est. Value
About This Home
This home is located at 1448 5th Ave, Corning, CA 96021 and is currently estimated at $215,316, approximately $159 per square foot. 1448 5th Ave is a home located in Tehama County with nearby schools including West Street Elementary School, Maywood Middle School, and Corning High School.
Ownership History
Date
Name
Owned For
Owner Type
Purchase Details
Closed on
Jul 12, 2016
Sold by
Miller Brian
Bought by
Miller Antoinette L
Current Estimated Value
Purchase Details
Closed on
Nov 2, 2001
Sold by
Howard Frank V and Howard Marlene L
Bought by
Miller Brian and Miller Antoinette L
Home Financials for this Owner
Home Financials are based on the most recent Mortgage that was taken out on this home.
Original Mortgage
$75,000
Outstanding Balance
$29,098
Interest Rate
6.62%
Mortgage Type
Seller Take Back
Estimated Equity
$186,218
Create a Home Valuation Report for This Property
The Home Valuation Report is an in-depth analysis detailing your home's value as well as a comparison with similar homes in the area
Purchase History
| Date | Buyer | Sale Price | Title Company |
|---|---|---|---|
| Miller Antoinette L | -- | None Available | |
| Miller Brian | $75,000 | Northern California Title Co |
Source: Public Records
Mortgage History
| Date | Status | Borrower | Loan Amount |
|---|---|---|---|
| Open | Miller Brian | $75,000 |
Source: Public Records
Tax History
| Year | Tax Paid | Tax Assessment Tax Assessment Total Assessment is a certain percentage of the fair market value that is determined by local assessors to be the total taxable value of land and additions on the property. | Land | Improvement |
|---|---|---|---|---|
| 2025 | $1,054 | $108,985 | $29,059 | $79,926 |
| 2023 | $1,033 | $104,755 | $27,932 | $76,823 |
| 2022 | $1,017 | $102,702 | $27,385 | $75,317 |
| 2021 | $978 | $100,690 | $26,849 | $73,841 |
| 2020 | $987 | $99,658 | $26,574 | $73,084 |
| 2019 | $946 | $97,704 | $26,053 | $71,651 |
| 2018 | $946 | $95,790 | $25,543 | $70,247 |
| 2017 | $902 | $90,563 | $24,150 | $66,413 |
| 2016 | $814 | $86,250 | $23,000 | $63,250 |
| 2015 | -- | $86,250 | $23,000 | $63,250 |
| 2014 | $707 | $75,000 | $20,000 | $55,000 |
Source: Public Records
Map
Nearby Homes
- 1311 6th Ave
- 1568 Link St
- 1162 5th Ave
- 806 Walnut St
- 815 Marin St
- 1308 Pear St
- 0 Houghton Ave Unit 324045531
- 1419 Yolo St
- 0 Toomes Ave Unit SN25272183
- 0 Toomes Ave Unit SN24222817
- 0 Toomes Ave Unit SN25176211
- 488 Chestnut St
- 617 Solano St
- 611 Hoag St
- 611 Hoag St Unit 250
- 2018 Donnovan Ave
- 1001 Toomes Ave
- 2067 Blossom Ave
- 409 4th St
- 1517 Tehama St
Your Personal Tour Guide
Ask me questions while you tour the home.