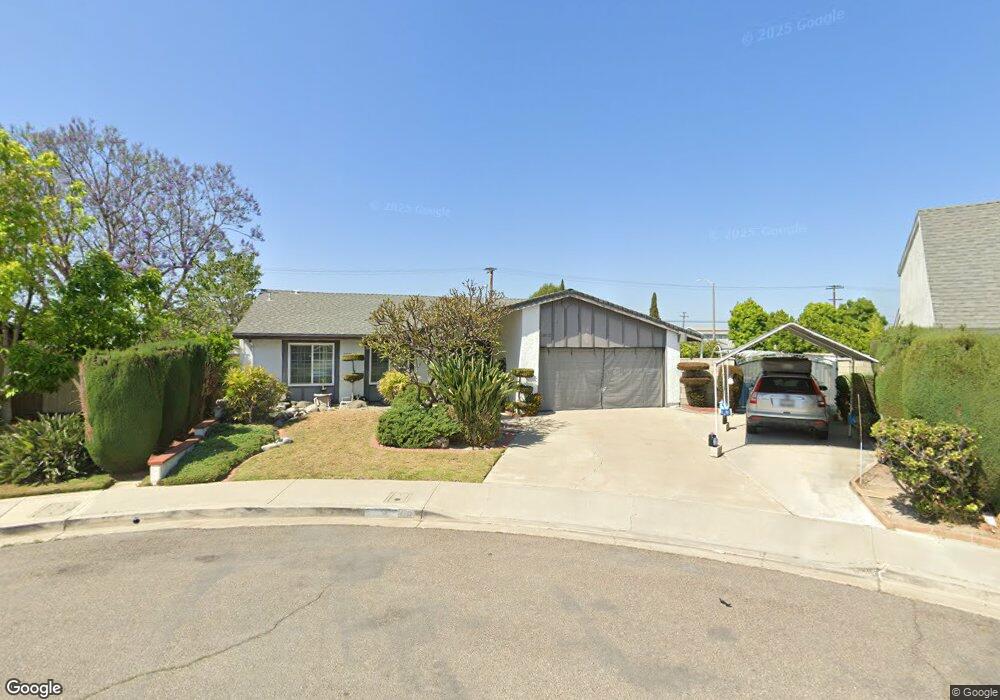
14512 Benchley Cir Westminster, CA 92683
Little Saigon NeighborhoodEstimated Value: $984,000 - $1,124,000
2
Beds
2
Baths
1,395
Sq Ft
$759/Sq Ft
Est. Value
About This Home
This home is located at 14512 Benchley Cir, Westminster, CA 92683 and is currently estimated at $1,058,567, approximately $758 per square foot. 14512 Benchley Cir is a home located in Orange County with nearby schools including Post Elementary, James Irvine Intermediate School, and La Quinta High School.
Ownership History
Date
Name
Owned For
Owner Type
Purchase Details
Closed on
Oct 21, 2024
Sold by
Chau An Ha and Huynh Ha
Bought by
An Ha Chau And Ha Huynh 2024 Revocable Trust and Chau
Current Estimated Value
Purchase Details
Closed on
Aug 3, 2024
Sold by
Chau Kent and Chau Michelle L
Bought by
Chau An Ha and Huynh Ha
Purchase Details
Closed on
Oct 29, 2002
Sold by
Chau Kent and Chau Michelle L
Bought by
Chau Kent and Chau Michelle L
Home Financials for this Owner
Home Financials are based on the most recent Mortgage that was taken out on this home.
Original Mortgage
$165,000
Interest Rate
5.99%
Purchase Details
Closed on
Sep 20, 1996
Sold by
Perry William A and Perry Ululani C
Bought by
Chau Kent and Chau Michelle L
Home Financials for this Owner
Home Financials are based on the most recent Mortgage that was taken out on this home.
Original Mortgage
$148,800
Interest Rate
8.3%
Create a Home Valuation Report for This Property
The Home Valuation Report is an in-depth analysis detailing your home's value as well as a comparison with similar homes in the area
Home Values in the Area
Average Home Value in this Area
Purchase History
| Date | Buyer | Sale Price | Title Company |
|---|---|---|---|
| An Ha Chau And Ha Huynh 2024 Revocable Trust | -- | None Listed On Document | |
| Chau An Ha | -- | None Listed On Document | |
| Chau Kent | -- | Landwood Title | |
| Chau Kent | $186,000 | Landwood Title Company |
Source: Public Records
Mortgage History
| Date | Status | Borrower | Loan Amount |
|---|---|---|---|
| Previous Owner | Chau Kent | $165,000 | |
| Previous Owner | Chau Kent | $148,800 |
Source: Public Records
Tax History Compared to Growth
Tax History
| Year | Tax Paid | Tax Assessment Tax Assessment Total Assessment is a certain percentage of the fair market value that is determined by local assessors to be the total taxable value of land and additions on the property. | Land | Improvement |
|---|---|---|---|---|
| 2025 | $5,096 | $670,092 | $541,885 | $128,207 |
| 2024 | $5,096 | $401,166 | $277,345 | $123,821 |
| 2023 | $4,998 | $393,300 | $271,906 | $121,394 |
| 2022 | $4,888 | $385,589 | $266,575 | $119,014 |
| 2021 | $4,818 | $378,029 | $261,348 | $116,681 |
| 2020 | $4,757 | $374,153 | $258,668 | $115,485 |
| 2019 | $4,671 | $366,817 | $253,596 | $113,221 |
| 2018 | $4,583 | $359,625 | $248,624 | $111,001 |
| 2017 | $4,525 | $352,574 | $243,749 | $108,825 |
| 2016 | $4,341 | $345,661 | $238,969 | $106,692 |
| 2015 | $4,284 | $340,469 | $235,379 | $105,090 |
| 2014 | $4,186 | $333,800 | $230,768 | $103,032 |
Source: Public Records
Map
Nearby Homes
- 14356 Taft St
- 14151 Lake St
- 10886 Lotus Dr
- 5317 Silver Dr
- 5405 W 4th St
- 14171 Flower St
- 812 N Euclid St
- 9884 11th St
- 10061 15th St
- 13322 Euclid St
- 9906 13th St
- 10632 Henderson Ave
- 14376 Euclid St Unit 1-4
- 9936 Pear Dr
- 323 N Euclid St Unit 99
- 9851 Bolsa Ave Unit 198
- 9851 Bolsa Ave Unit 196
- 5132 W 1st St Unit B
- 4832 W 5th St Unit B
- 5112 W 1st St Unit C
- 14522 Benchley Cir
- 14521 Abington Cir
- 14511 Abington Cir
- 14532 Benchley Cir
- 14521 Benchley Cir
- 10411 Hazard Ave
- 10421 Hazard Ave
- 14531 Abington Cir
- 10401 Hazard Ave
- 14531 Benchley Cir
- 10431 Hazard Ave
- 14542 Benchley Cir
- 14512 Petsworth Ln
- 10381 Hazard Ave
- 14541 Abington Cir
- 14541 Benchley Cir
- 10451 Hazard Ave
- 14512 Abington Cir
- 14532 Petsworth Ln
- 14552 Benchley Cir