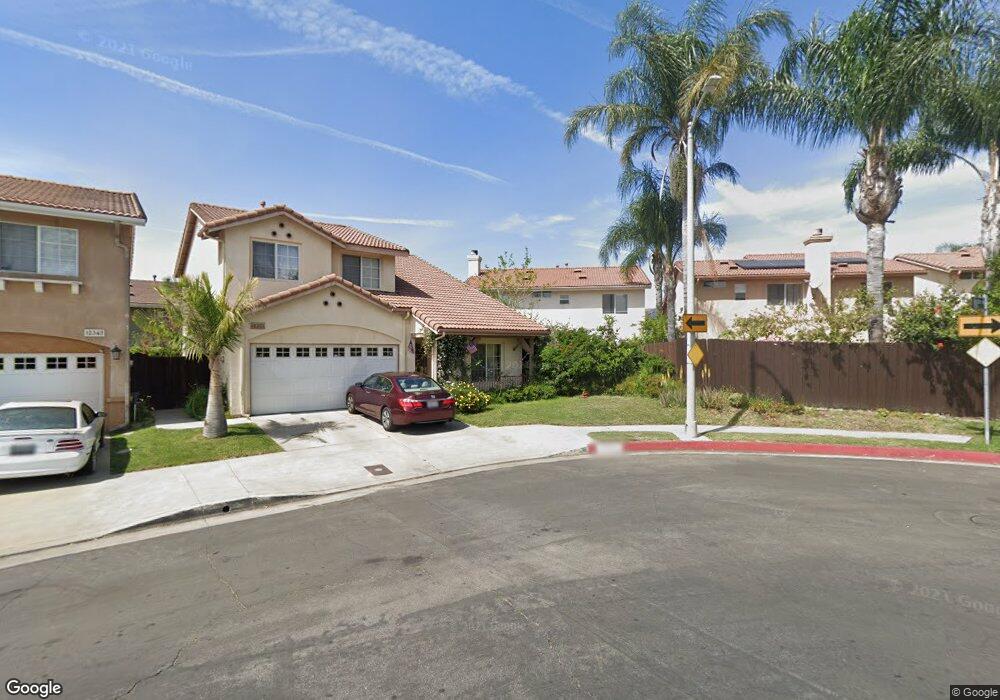
14513 Village Way Dr Sylmar, CA 91342
Estimated Value: $710,000 - $900,778
4
Beds
3
Baths
1,799
Sq Ft
$455/Sq Ft
Est. Value
About This Home
This home is located at 14513 Village Way Dr, Sylmar, CA 91342 and is currently estimated at $818,195, approximately $454 per square foot. 14513 Village Way Dr is a home located in Los Angeles County with nearby schools including Dyer Street Elementary School, Olive Vista Middle School, and San Fernando Senior High School.
Ownership History
Date
Name
Owned For
Owner Type
Purchase Details
Closed on
Jun 15, 2020
Sold by
Minosyan Zhrayr N
Bought by
Minosyan Zhrayr N and Minosyan Norayr
Current Estimated Value
Home Financials for this Owner
Home Financials are based on the most recent Mortgage that was taken out on this home.
Original Mortgage
$273,800
Outstanding Balance
$192,479
Interest Rate
3.2%
Mortgage Type
New Conventional
Estimated Equity
$625,716
Purchase Details
Closed on
Sep 10, 2002
Sold by
Minosyan Margarita V
Bought by
Minosyan Zhrayr N
Purchase Details
Closed on
May 24, 2002
Sold by
Hubbard Street Llc
Bought by
Minosyan Zhrayr N
Home Financials for this Owner
Home Financials are based on the most recent Mortgage that was taken out on this home.
Original Mortgage
$215,992
Interest Rate
6.05%
Create a Home Valuation Report for This Property
The Home Valuation Report is an in-depth analysis detailing your home's value as well as a comparison with similar homes in the area
Home Values in the Area
Average Home Value in this Area
Purchase History
| Date | Buyer | Sale Price | Title Company |
|---|---|---|---|
| Minosyan Zhrayr N | -- | Usa National Title Co | |
| Minosyan Zhrayr N | -- | Chicago Title Co | |
| Minosyan Zhrayr N | -- | Chicago Title Co |
Source: Public Records
Mortgage History
| Date | Status | Borrower | Loan Amount |
|---|---|---|---|
| Open | Minosyan Zhrayr N | $273,800 | |
| Previous Owner | Minosyan Zhrayr N | $215,992 | |
| Closed | Minosyan Zhrayr N | $26,999 |
Source: Public Records
Tax History Compared to Growth
Tax History
| Year | Tax Paid | Tax Assessment Tax Assessment Total Assessment is a certain percentage of the fair market value that is determined by local assessors to be the total taxable value of land and additions on the property. | Land | Improvement |
|---|---|---|---|---|
| 2025 | $4,772 | $391,025 | $185,810 | $205,215 |
| 2024 | $4,772 | $383,359 | $182,167 | $201,192 |
| 2023 | $4,680 | $375,844 | $178,596 | $197,248 |
| 2022 | $4,463 | $368,476 | $175,095 | $193,381 |
| 2021 | $4,400 | $361,252 | $171,662 | $189,590 |
| 2019 | $4,273 | $350,538 | $166,571 | $183,967 |
| 2018 | $4,197 | $343,665 | $163,305 | $180,360 |
| 2017 | $4,103 | $336,927 | $160,103 | $176,824 |
| 2016 | $3,993 | $330,321 | $156,964 | $173,357 |
| 2015 | $3,935 | $325,361 | $154,607 | $170,754 |
| 2014 | $3,952 | $318,989 | $151,579 | $167,410 |
Source: Public Records
Map
Nearby Homes
- 14388 Beaver St
- 14335 Aztec St
- 12563 Bradley Ave Unit 13
- 14263 Hubbard St
- 14909 W Navarre Way
- 14761 Astoria St
- 12259 N Lima Way
- 14690 Hubbard St
- 12603 Ralston Ave
- 316 Orange Grove Ave
- 12446 Herrick Ave
- 14968 Bleeker St
- 12642 Ralston Ave Unit 1
- 12659 Ralston Ave
- 11968 Rossiter Place
- 12796 Norris Ave
- 14840 Polk St
- 428 Fermoore St
- 14365 Berg St
- 431 N Workman St
- 12376 Twilight Ave
- 12347 Twilight Ave
- 12355 Twilight Ave
- 12238 Windmere Ave
- 12360 Twilight Ave
- 14509 Village Way Dr
- 12356 Twilight Ave
- 12342 Twilight Ave
- 12359 Twilight Ave
- 12350 Twilight Ave
- 12338 Twilight Ave
- 12364 Twilight Ave
- 12347 Ralston Ave
- 12339 Ralston Ave Unit 84
- 14610 Tundra Dr
- 12343 Twilight Ave
- 12351 Twilight Ave
- 12346 Twilight Ave
- 14614 Tundra Dr Unit 137
- 14614 Tundra Dr