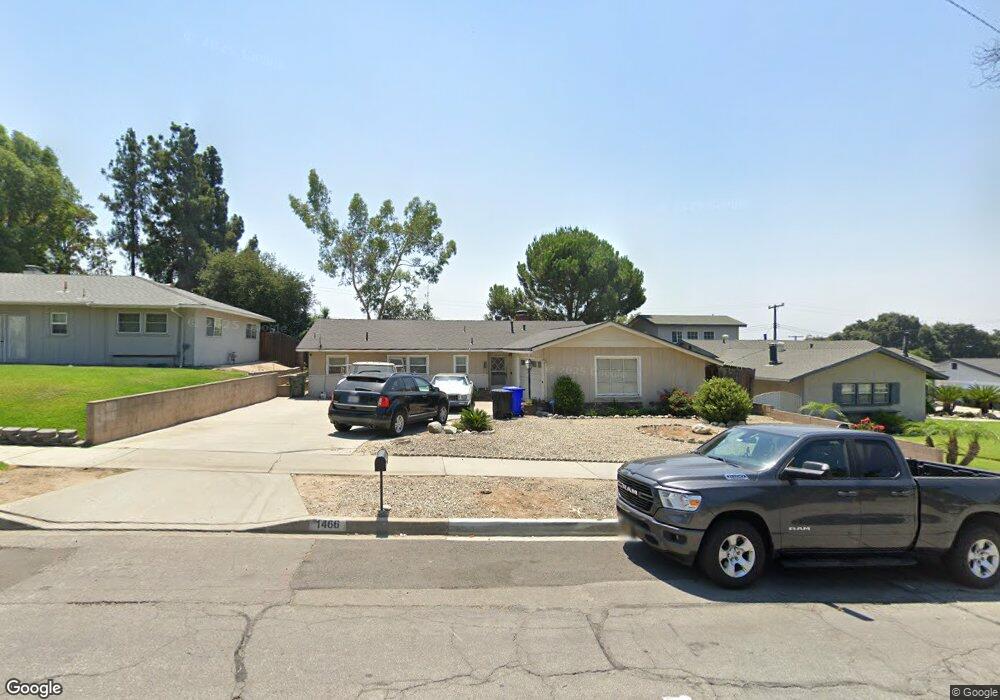
1466 E 13th St Upland, CA 91786
Estimated Value: $643,595 - $698,000
2
Beds
2
Baths
1,284
Sq Ft
$523/Sq Ft
Est. Value
About This Home
This home is located at 1466 E 13th St, Upland, CA 91786 and is currently estimated at $672,149, approximately $523 per square foot. 1466 E 13th St is a home located in San Bernardino County with nearby schools including Foothill Knolls STEM Academy of Innovation, Upland High School, and Children's Montessori School.
Ownership History
Date
Name
Owned For
Owner Type
Purchase Details
Closed on
Jul 20, 2023
Sold by
Durkin Michael T
Bought by
Michael T Durkin Revocable Trust and Durkin
Current Estimated Value
Purchase Details
Closed on
Mar 29, 2018
Sold by
Durkin Michael T
Bought by
Durkin Michael T
Purchase Details
Closed on
Apr 16, 2001
Sold by
Durkin John E
Bought by
Durkin John E and Durkin Twila B
Purchase Details
Closed on
Oct 10, 2000
Sold by
Hoff Stanley C
Bought by
Durkin John E and Durkin Twila B
Purchase Details
Closed on
Nov 24, 1997
Sold by
Exon Thomas M
Bought by
Hoff Stanley C
Home Financials for this Owner
Home Financials are based on the most recent Mortgage that was taken out on this home.
Original Mortgage
$116,461
Interest Rate
7.23%
Mortgage Type
FHA
Create a Home Valuation Report for This Property
The Home Valuation Report is an in-depth analysis detailing your home's value as well as a comparison with similar homes in the area
Home Values in the Area
Average Home Value in this Area
Purchase History
| Date | Buyer | Sale Price | Title Company |
|---|---|---|---|
| Michael T Durkin Revocable Trust | -- | None Listed On Document | |
| Durkin Michael T | -- | Accommodation | |
| Durkin John E | -- | -- | |
| Durkin John E | $161,000 | Gateway Title Company | |
| Hoff Stanley C | $117,000 | First American Title | |
| Exon Thomas M | -- | First American Title |
Source: Public Records
Mortgage History
| Date | Status | Borrower | Loan Amount |
|---|---|---|---|
| Previous Owner | Hoff Stanley C | $116,461 |
Source: Public Records
Tax History Compared to Growth
Tax History
| Year | Tax Paid | Tax Assessment Tax Assessment Total Assessment is a certain percentage of the fair market value that is determined by local assessors to be the total taxable value of land and additions on the property. | Land | Improvement |
|---|---|---|---|---|
| 2025 | $2,721 | $242,603 | $84,911 | $157,692 |
| 2024 | $2,721 | $237,846 | $83,246 | $154,600 |
| 2023 | $2,679 | $233,183 | $81,614 | $151,569 |
| 2022 | $2,620 | $228,611 | $80,014 | $148,597 |
| 2021 | $2,615 | $224,128 | $78,445 | $145,683 |
| 2020 | $2,544 | $221,830 | $77,641 | $144,189 |
| 2019 | $2,536 | $217,481 | $76,119 | $141,362 |
| 2018 | $2,401 | $328,598 | $113,124 | $215,474 |
| 2017 | $2,331 | $209,038 | $73,164 | $135,874 |
| 2016 | $2,143 | $204,939 | $71,729 | $133,210 |
| 2015 | $2,093 | $201,861 | $70,652 | $131,209 |
| 2014 | $2,038 | $197,907 | $69,268 | $128,639 |
Source: Public Records
Map
Nearby Homes
- 1415 E Anita St
- 1317 Monte Verde Ave
- 1130 N 13th Ave
- 1382 Crawford Ave
- Residence Two LW Plan at Sycamore Heights - Woodland
- Residence One Plan at Sycamore Heights - Woodland
- Residence Two Plan at Sycamore Heights - Green Leaf
- Residence One LW Plan at Sycamore Heights - Woodland
- Residence Three Plan at Sycamore Heights - Woodland
- Residence Three Plan at Sycamore Heights - Green Leaf
- Residence Two Plan at Sycamore Heights - Woodland
- Residence Three LW Plan at Sycamore Heights - Woodland
- Residence One Plan at Sycamore Heights - Green Leaf
- 8341 Gabrielino Ct
- 8321 Gabrielino Ct
- 8309 Gabrielino Ct
- 8409 Tapia Way
- 929 E Foothill Blvd Unit 91
- 929 E Foothill Blvd Unit 15
- 929 E Foothill Blvd Unit 23
- 1476 E 13th St
- 1444 E 13th St
- 1457 Bonita St
- 1447 Bonita St
- 1436 E 13th St
- 1289 Grove Ave
- 1273 Grove Ave
- 1463 E 13th St
- 1463 E 13th St
- 1435 Bonita St
- 1473 E 13th St
- 1255 Grove Ave
- 1460 Bonita St
- 1437 E 13th St
- 1424 E 13th St
- 1305 Grove Ave
- 1425 Bonita St
- 1239 Grove Ave
- 1427 E 13th St
- 1478 Loma Sola Ct