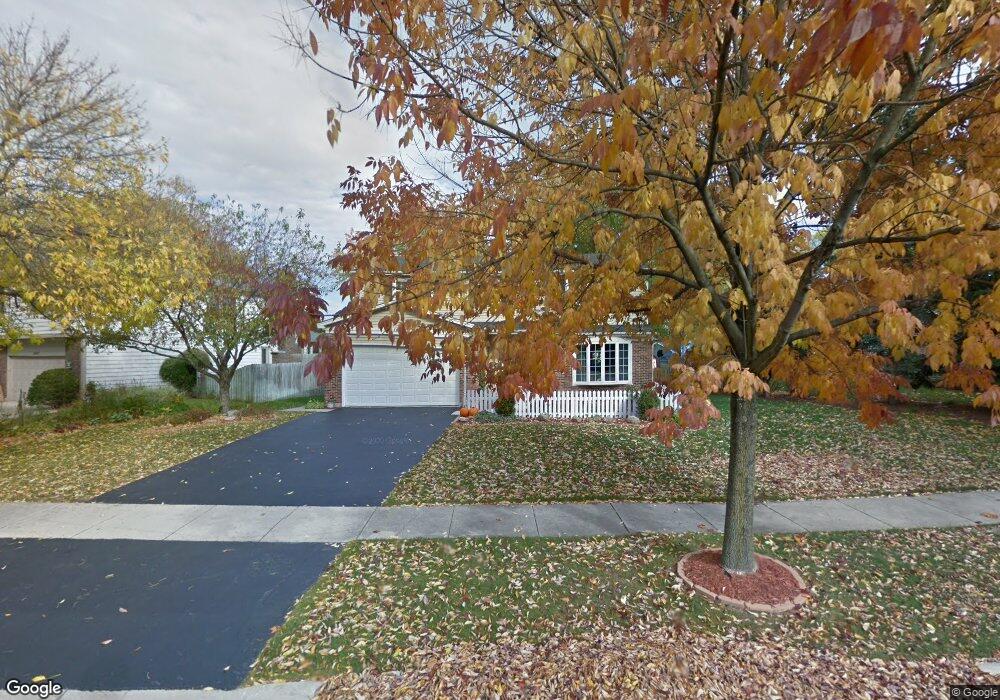
1468 Applegate Dr Naperville, IL 60565
Westglen NeighborhoodEstimated Value: $565,680 - $639,000
5
Beds
3
Baths
2,496
Sq Ft
$237/Sq Ft
Est. Value
About This Home
This home is located at 1468 Applegate Dr, Naperville, IL 60565 and is currently estimated at $592,420, approximately $237 per square foot. 1468 Applegate Dr is a home located in DuPage County with nearby schools including Owen Elementary School, Still Middle School, and Waubonsie Valley High School.
Ownership History
Date
Name
Owned For
Owner Type
Purchase Details
Closed on
Sep 27, 2023
Sold by
Thomas Mark R and Thomas Cynthia A
Bought by
Mark R Thomas And Cynthia A Thomas Living Tru and Thomas
Current Estimated Value
Purchase Details
Closed on
Oct 29, 2007
Sold by
Loberg Jason B and Loberg Christine M
Bought by
Thomas Mark R and Thomas Cynthia A
Home Financials for this Owner
Home Financials are based on the most recent Mortgage that was taken out on this home.
Original Mortgage
$299,000
Interest Rate
6.44%
Mortgage Type
Purchase Money Mortgage
Purchase Details
Closed on
May 23, 2000
Sold by
Oconnor Patrick R and Oconnor Mary K
Bought by
Loberg Jason B and Loberg Christine M
Home Financials for this Owner
Home Financials are based on the most recent Mortgage that was taken out on this home.
Original Mortgage
$198,000
Interest Rate
7.87%
Create a Home Valuation Report for This Property
The Home Valuation Report is an in-depth analysis detailing your home's value as well as a comparison with similar homes in the area
Home Values in the Area
Average Home Value in this Area
Purchase History
| Date | Buyer | Sale Price | Title Company |
|---|---|---|---|
| Mark R Thomas And Cynthia A Thomas Living Tru | -- | None Listed On Document | |
| Thomas Mark R | $418,000 | First American Title Ins Co | |
| Loberg Jason B | $247,833 | First American Title |
Source: Public Records
Mortgage History
| Date | Status | Borrower | Loan Amount |
|---|---|---|---|
| Previous Owner | Thomas Mark R | $299,000 | |
| Previous Owner | Loberg Jason B | $198,000 |
Source: Public Records
Tax History
| Year | Tax Paid | Tax Assessment Tax Assessment Total Assessment is a certain percentage of the fair market value that is determined by local assessors to be the total taxable value of land and additions on the property. | Land | Improvement |
|---|---|---|---|---|
| 2024 | $9,915 | $174,848 | $48,500 | $126,348 |
| 2023 | $9,435 | $157,110 | $43,580 | $113,530 |
| 2022 | $9,348 | $147,790 | $40,670 | $107,120 |
| 2021 | $9,040 | $142,520 | $39,220 | $103,300 |
| 2020 | $9,028 | $142,520 | $39,220 | $103,300 |
| 2019 | $9,001 | $135,550 | $37,300 | $98,250 |
| 2018 | $8,797 | $130,270 | $35,570 | $94,700 |
| 2017 | $8,553 | $125,850 | $34,360 | $91,490 |
| 2016 | $8,396 | $120,770 | $32,970 | $87,800 |
| 2015 | $8,315 | $114,660 | $31,300 | $83,360 |
| 2014 | $8,155 | $108,880 | $29,500 | $79,380 |
| 2013 | $8,137 | $109,630 | $29,700 | $79,930 |
Source: Public Records
Map
Nearby Homes
- 534 Grimes Ave
- 1447 Baldwin Ct
- 289 Winding Creek Dr
- 817 Cardiff Rd
- 628 Flock Ave Unit 3
- 833 Havenshire Rd Unit 833
- 308 Tamarack Ave
- 1033 Emerald Dr
- 808 Shiloh Cir
- 316 Hemlock Ln
- 313 W Gartner Rd
- 316 Sycamore Dr Unit 11
- 77 Bluebird Ln
- 332 Prairie Knoll Dr
- 362 Ripley Ct
- 845 Tulip Ln
- 381 Prairie Knoll Dr
- 2049 Dorval Dr
- 840 Mobile Ct
- 2023 Springside Dr
- 1462 Applegate Dr
- 1474 Applegate Dr
- 1458 Applegate Dr
- 436 Westglen Dr
- 1465 Applegate Dr
- 1465 Applegate Dr
- 1480 Applegate Dr
- 1469 Applegate Dr
- 432 Westglen Dr
- 1473 Applegate Dr
- 1459 Applegate Dr
- 1484 Applegate Dr Unit 1
- 1477 Applegate Dr
- 1455 Applegate Dr
- 428 Westglen Dr
- 1481 Applegate Dr
- 439 Westglen Dr
- 435 Westglen Dr
- 443 Westglen Dr
- 431 Westglen Dr
Your Personal Tour Guide
Ask me questions while you tour the home.