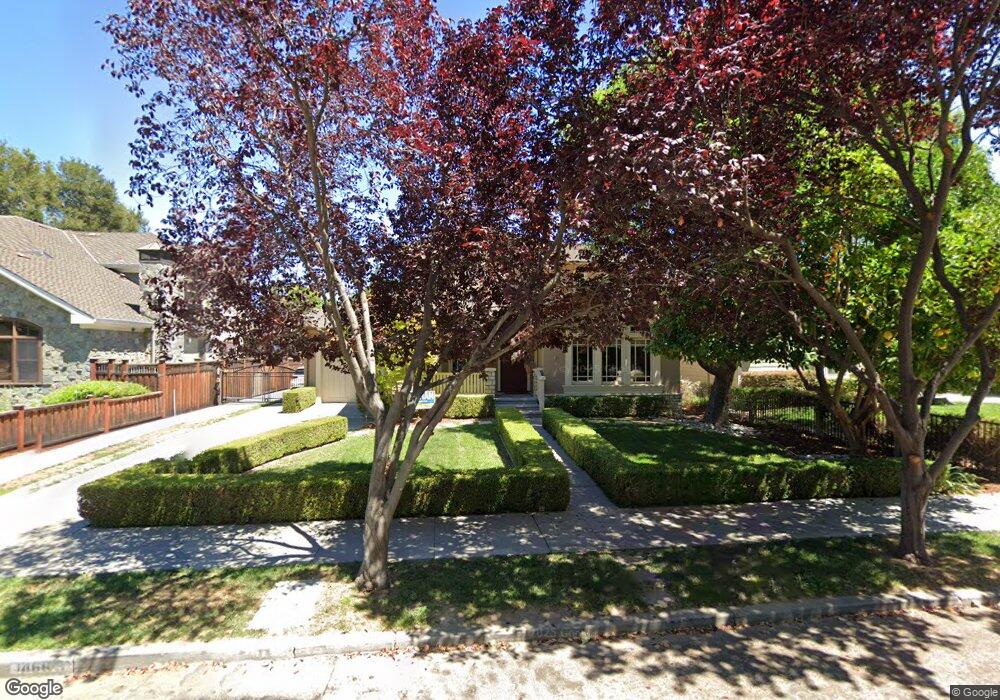
1468 Lupton Ave San Jose, CA 95125
Willow Glen NeighborhoodEstimated Value: $3,845,000 - $5,388,000
4
Beds
3
Baths
4,649
Sq Ft
$939/Sq Ft
Est. Value
About This Home
This home is located at 1468 Lupton Ave, San Jose, CA 95125 and is currently estimated at $4,365,960, approximately $939 per square foot. 1468 Lupton Ave is a home located in Santa Clara County with nearby schools including Willow Glen Elementary, Willow Glen Middle, and Willow Glen High School.
Ownership History
Date
Name
Owned For
Owner Type
Purchase Details
Closed on
Jun 21, 2012
Sold by
Soule Erik M and Turner Rebecca L
Bought by
Soule Erik M and Turner Rebecca L
Current Estimated Value
Home Financials for this Owner
Home Financials are based on the most recent Mortgage that was taken out on this home.
Original Mortgage
$625,500
Outstanding Balance
$92,263
Interest Rate
3.74%
Mortgage Type
New Conventional
Estimated Equity
$4,273,697
Purchase Details
Closed on
Jul 2, 2010
Sold by
Smith Rex C and Smith Julie B
Bought by
Soule Erik M and Turner Rebecca L
Home Financials for this Owner
Home Financials are based on the most recent Mortgage that was taken out on this home.
Original Mortgage
$1,600,000
Outstanding Balance
$1,062,689
Interest Rate
4.71%
Mortgage Type
New Conventional
Estimated Equity
$3,303,271
Purchase Details
Closed on
Apr 11, 2003
Sold by
Smith Rex C and Smith Julie B
Bought by
Smith Rex C and Smith Julie B
Purchase Details
Closed on
Apr 3, 1998
Sold by
Bunheirao Walter H
Bought by
Smith Rex C and Smith Julie B
Home Financials for this Owner
Home Financials are based on the most recent Mortgage that was taken out on this home.
Original Mortgage
$348,000
Interest Rate
7.07%
Create a Home Valuation Report for This Property
The Home Valuation Report is an in-depth analysis detailing your home's value as well as a comparison with similar homes in the area
Home Values in the Area
Average Home Value in this Area
Purchase History
| Date | Buyer | Sale Price | Title Company |
|---|---|---|---|
| Soule Erik M | -- | Old Republic Title Company | |
| Soule Erik M | -- | Old Republic Title Company | |
| Soule Erik M | $2,000,000 | Cornerstone Title Company | |
| Smith Rex C | -- | -- | |
| Smith Rex C | $600,000 | Financial Title Company |
Source: Public Records
Mortgage History
| Date | Status | Borrower | Loan Amount |
|---|---|---|---|
| Open | Soule Erik M | $625,500 | |
| Open | Soule Erik M | $1,600,000 | |
| Previous Owner | Smith Rex C | $348,000 |
Source: Public Records
Tax History
| Year | Tax Paid | Tax Assessment Tax Assessment Total Assessment is a certain percentage of the fair market value that is determined by local assessors to be the total taxable value of land and additions on the property. | Land | Improvement |
|---|---|---|---|---|
| 2025 | $31,809 | $2,675,638 | $1,665,527 | $1,010,111 |
| 2024 | $31,809 | $2,623,175 | $1,632,870 | $990,305 |
| 2023 | $31,272 | $2,571,741 | $1,600,853 | $970,888 |
| 2022 | $31,005 | $2,521,315 | $1,569,464 | $951,851 |
| 2021 | $30,300 | $2,471,879 | $1,538,691 | $933,188 |
| 2020 | $29,709 | $2,446,534 | $1,522,914 | $923,620 |
| 2019 | $29,126 | $2,398,563 | $1,493,053 | $905,510 |
| 2018 | $28,883 | $2,351,533 | $1,463,778 | $887,755 |
| 2017 | $28,681 | $2,305,426 | $1,435,077 | $870,349 |
| 2016 | $28,383 | $2,260,223 | $1,406,939 | $853,284 |
| 2015 | $28,230 | $2,226,273 | $1,385,806 | $840,467 |
| 2014 | $27,674 | $2,182,664 | $1,358,660 | $824,004 |
Source: Public Records
Map
Nearby Homes
- 1224 Glenwood Ave
- 1335 Glenwood Ave
- 1140 Glenmeadow Ct
- 1169 Minnesota Ave Unit 1
- 1248 Camino Pablo
- 1141 Dean Ave
- 1736 Wilcox Way
- 1538 Lincoln Ave
- 1192 Crescent Dr
- 1512 Minnesota Ave
- 1127 Norval Way
- 1823 Lincoln Ave
- 1197 Willow St
- 1715 Sandy Creek Ln
- 1549 Keesling Ave
- 1490 Curtiss Ave
- 1013 Camino Pablo
- 1256 Malone Rd
- 1641 Isabel Dr
- 1109 Garfield Ave
- 1460 Lupton Ave
- 1452 Lupton Ave
- 1484 Lupton Ave
- 1456 Lupton Ave
- 1494 Lupton Ave
- 1440 Lupton Ave
- 1475 Lupton Ave
- 1485 Lupton Ave
- 1455 Lupton Ave
- 1438 Lupton Ave
- 1495 Lupton Ave
- 1436 Lupton Ave
- 1504 Lupton Ave
- 1443 Lupton Ave
- 1505 Lupton Ave
- 1487 Newport Ave
- 1510 Lupton Ave
- 1503 Newport Ave
- 1500 Lupton Ave
- 1437 Lupton Ave
Your Personal Tour Guide
Ask me questions while you tour the home.