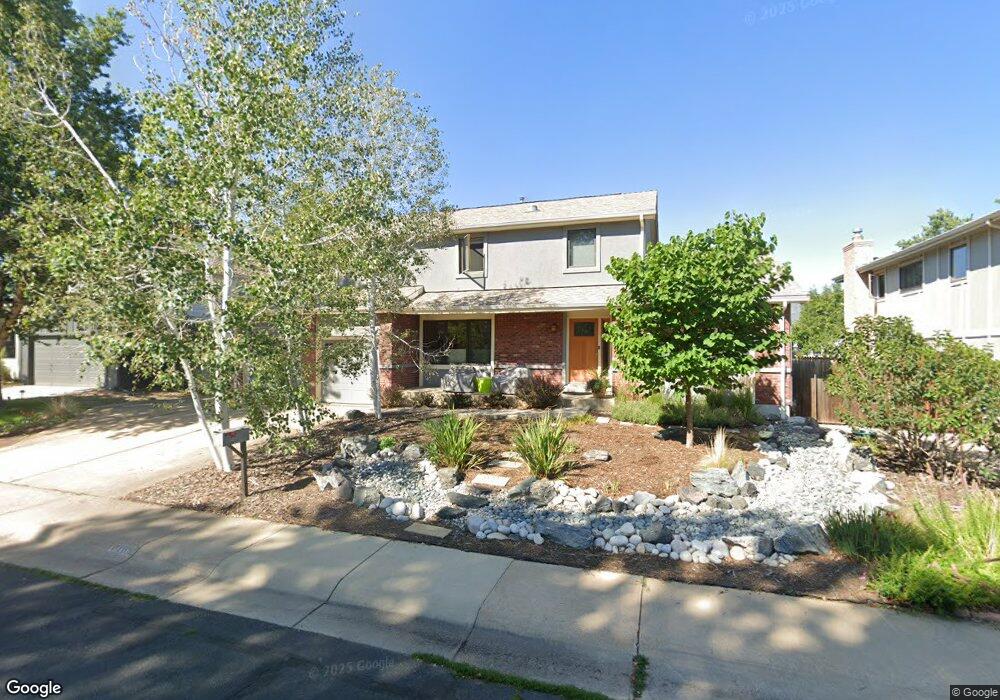
1469 Johnson Ct Boulder, CO 80303
Southeast Boulder NeighborhoodEstimated Value: $1,237,849 - $1,471,000
4
Beds
3
Baths
2,330
Sq Ft
$594/Sq Ft
Est. Value
About This Home
This home is located at 1469 Johnson Ct, Boulder, CO 80303 and is currently estimated at $1,382,962, approximately $593 per square foot. 1469 Johnson Ct is a home located in Boulder County with nearby schools including Eisenhower Elementary School, Manhattan Middle School of the Arts & Academics, and Fairview High School.
Ownership History
Date
Name
Owned For
Owner Type
Purchase Details
Closed on
Jan 21, 2002
Sold by
Kaliski Kathryn A and Kaliski Robert W
Bought by
Kaliski Kathryn A
Current Estimated Value
Home Financials for this Owner
Home Financials are based on the most recent Mortgage that was taken out on this home.
Original Mortgage
$384,100
Outstanding Balance
$158,189
Interest Rate
7.15%
Estimated Equity
$1,224,773
Purchase Details
Closed on
Feb 28, 2001
Sold by
Cairy Thomas L and Cairy Mary E
Bought by
Mcdonald Kathryn A
Home Financials for this Owner
Home Financials are based on the most recent Mortgage that was taken out on this home.
Original Mortgage
$380,000
Interest Rate
6.97%
Purchase Details
Closed on
Apr 4, 1979
Bought by
Kaliski Kathryn A and Kaliski Robert W
Purchase Details
Closed on
Nov 26, 1973
Bought by
Kaliski Kathryn A and Kaliski Robert W
Create a Home Valuation Report for This Property
The Home Valuation Report is an in-depth analysis detailing your home's value as well as a comparison with similar homes in the area
Home Values in the Area
Average Home Value in this Area
Purchase History
| Date | Buyer | Sale Price | Title Company |
|---|---|---|---|
| Kaliski Kathryn A | -- | -- | |
| Mcdonald Kathryn A | $475,000 | -- | |
| Kaliski Kathryn A | $195,000 | -- | |
| Kaliski Kathryn A | $52,900 | -- |
Source: Public Records
Mortgage History
| Date | Status | Borrower | Loan Amount |
|---|---|---|---|
| Open | Kaliski Kathryn A | $384,100 | |
| Closed | Mcdonald Kathryn A | $380,000 |
Source: Public Records
Tax History
| Year | Tax Paid | Tax Assessment Tax Assessment Total Assessment is a certain percentage of the fair market value that is determined by local assessors to be the total taxable value of land and additions on the property. | Land | Improvement |
|---|---|---|---|---|
| 2025 | $7,575 | $76,700 | $37,456 | $39,244 |
| 2024 | $7,575 | $76,700 | $37,456 | $39,244 |
| 2023 | $7,443 | $86,189 | $45,037 | $44,836 |
| 2022 | $6,134 | $66,049 | $33,089 | $32,960 |
| 2021 | $5,849 | $67,950 | $34,041 | $33,909 |
| 2020 | $5,288 | $60,747 | $28,958 | $31,789 |
| 2019 | $5,207 | $60,747 | $28,958 | $31,789 |
| 2018 | $5,169 | $59,624 | $28,008 | $31,616 |
| 2017 | $5,008 | $65,916 | $30,964 | $34,952 |
| 2016 | $4,598 | $53,117 | $21,253 | $31,864 |
| 2015 | $4,354 | $45,460 | $11,940 | $33,520 |
| 2014 | $3,822 | $45,460 | $11,940 | $33,520 |
Source: Public Records
Map
Nearby Homes
- 5044 Gallatin Place
- 5016 Forsythe Place
- 5411 White Place
- 5586 Pennsylvania Ave
- 1180 Monroe Dr Unit B
- 4222 Monroe Dr Unit C
- 1533 Old Tale Rd
- 695 Manhattan Dr Unit 116
- 695 Manhattan Dr Unit 109
- 695 Manhattan Dr Unit 219
- 5550 Stonewall Place Unit 33
- 3601 Arapahoe Ave Unit 408
- 3601 Arapahoe Ave Unit 205
- 655 Cree Cir
- 665 Manhattan Dr Unit 9
- 4500 Baseline Rd Unit 1208
- 4415 Laguna Place Unit 201
- 600 Manhattan Dr Unit A7
- 625 Manhattan Place Unit 308
- 3301 Arapahoe Ave Unit 107
- 1449 Johnson Ct
- 1489 Johnson Ct
- 1464 Kennedy Ct
- 1444 Kennedy Ct
- 1484 Kennedy Ct
- 1429 Johnson Ct
- 1466 Johnson Ct
- 1446 Johnson Ct
- 1486 Johnson Ct
- 5055 Merritt Dr
- 5075 Merritt Dr
- 1409 Johnson Ct
- 5095 Merritt Dr
- 5035 Merritt Dr
- 5085 Merritt Dr
- 5025 Merritt Dr
- 5005 Merritt Dr
- 1487 Kennedy Ct
- 5015 Merritt Dr
- 1404 Kennedy Ct
Your Personal Tour Guide
Ask me questions while you tour the home.