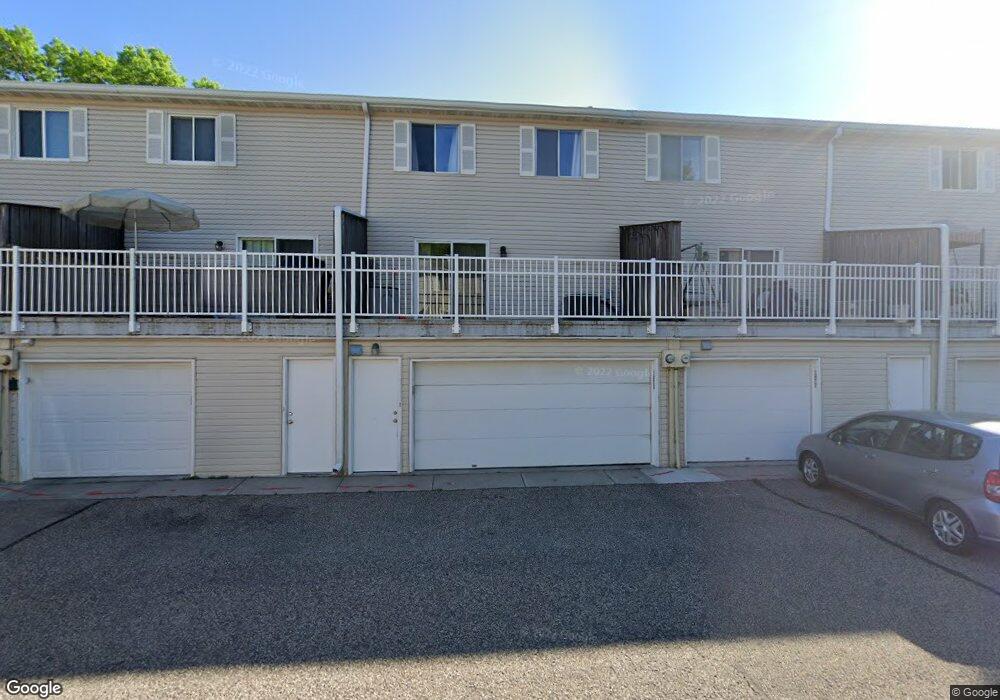
1473 Goodwin Ave N Saint Paul, MN 55128
Estimated Value: $213,000 - $231,000
2
Beds
2
Baths
2,000
Sq Ft
$110/Sq Ft
Est. Value
About This Home
This home is located at 1473 Goodwin Ave N, Saint Paul, MN 55128 and is currently estimated at $220,965, approximately $110 per square foot. 1473 Goodwin Ave N is a home located in Washington County with nearby schools including Skyview Community Middle School, Tartan Senior High School, and Achieve Language Academy.
Ownership History
Date
Name
Owned For
Owner Type
Purchase Details
Closed on
Nov 13, 2020
Sold by
Holmes Krystal and Holmes Charles
Bought by
Lee Mai Nhia
Current Estimated Value
Home Financials for this Owner
Home Financials are based on the most recent Mortgage that was taken out on this home.
Original Mortgage
$169,750
Outstanding Balance
$151,053
Interest Rate
2.8%
Mortgage Type
New Conventional
Estimated Equity
$69,912
Purchase Details
Closed on
Jun 30, 2015
Sold by
Rivera Roland W and Palm Rivera Julie
Bought by
Holmes Charles Michael and Mortensen Krystal Ann
Home Financials for this Owner
Home Financials are based on the most recent Mortgage that was taken out on this home.
Original Mortgage
$126,331
Interest Rate
3.25%
Mortgage Type
FHA
Purchase Details
Closed on
Jul 15, 1999
Sold by
Gruenhagen Theresa C
Bought by
Rivera Roland W
Purchase Details
Closed on
Mar 12, 1996
Sold by
Michaelson Teres
Bought by
Grenhagen Theresa C
Create a Home Valuation Report for This Property
The Home Valuation Report is an in-depth analysis detailing your home's value as well as a comparison with similar homes in the area
Home Values in the Area
Average Home Value in this Area
Purchase History
| Date | Buyer | Sale Price | Title Company |
|---|---|---|---|
| Lee Mai Nhia | $175,000 | All American Title Co Inc | |
| Holmes Charles Michael | $128,663 | Burnet Title | |
| Rivera Roland W | $91,400 | -- | |
| Grenhagen Theresa C | $56,000 | -- | |
| Lee Mai Mai | $175,000 | -- |
Source: Public Records
Mortgage History
| Date | Status | Borrower | Loan Amount |
|---|---|---|---|
| Open | Lee Mai Nhia | $169,750 | |
| Previous Owner | Holmes Charles Michael | $126,331 | |
| Closed | Lee Mai Mai | $173,000 |
Source: Public Records
Tax History Compared to Growth
Tax History
| Year | Tax Paid | Tax Assessment Tax Assessment Total Assessment is a certain percentage of the fair market value that is determined by local assessors to be the total taxable value of land and additions on the property. | Land | Improvement |
|---|---|---|---|---|
| 2024 | $2,208 | $210,400 | $50,000 | $160,400 |
| 2023 | $2,208 | $225,100 | $75,000 | $150,100 |
| 2022 | $1,786 | $189,000 | $53,600 | $135,400 |
| 2021 | $1,624 | $166,100 | $47,500 | $118,600 |
| 2020 | $1,628 | $153,100 | $42,500 | $110,600 |
| 2019 | $1,280 | $150,200 | $42,500 | $107,700 |
| 2018 | $1,044 | $124,600 | $32,500 | $92,100 |
| 2017 | $1,042 | $105,600 | $16,000 | $89,600 |
| 2016 | $1,096 | $101,000 | $15,000 | $86,000 |
| 2015 | $1,026 | $76,400 | $13,900 | $62,500 |
| 2013 | -- | $62,500 | $12,300 | $50,200 |
Source: Public Records
Map
Nearby Homes
- 6297 15th St N
- 1383 Granada Trail N
- 1306 Guthrie Ave N
- 1105 Greystone Ave N
- 6551 22nd St N
- 935 Ferndale St N Unit 210
- 935 Ferndale St N Unit 302
- 7061 Upper 17th St N
- 6860 8th Street Ln N
- 6864 8th Street Ln N
- 6510 23rd St N
- 698 Grafton Ave N
- 2001 Gresham Ave N Unit 18
- 2056 Gresham Ave N
- 6783 8th St N
- 659 Goodview Ave N
- 7018 19th St N Unit 1
- 6884 8th Street Ln N
- 2033 Gresham Ave N
- 2059 Gresham Ave N
- 1477 Goodwin Ave N
- 1469 Goodwin Ave N
- 1481 Goodwin Ave N
- 1465 Goodwin Ave N
- 1485 Goodwin Ave N
- 1461 Goodwin Ave N
- 1457 Goodwin Ave N
- 1467 Goodwin Ave N
- 1471 Goodwin Ave N
- 1475 Goodwin Ave N
- 1479 Goodwin Ave N
- 1487 Goodwin Ave N
- 1463 Goodwin Ave N
- 1489 Goodwin Ave N
- 1459 Goodwin Ave N
- 1483 Goodwin Ave N
- 1493 Goodwin Ave N
- 1455 Goodwin Ave N
- 1495 Goodwin Ave N
- 1497 Goodwin Ave N