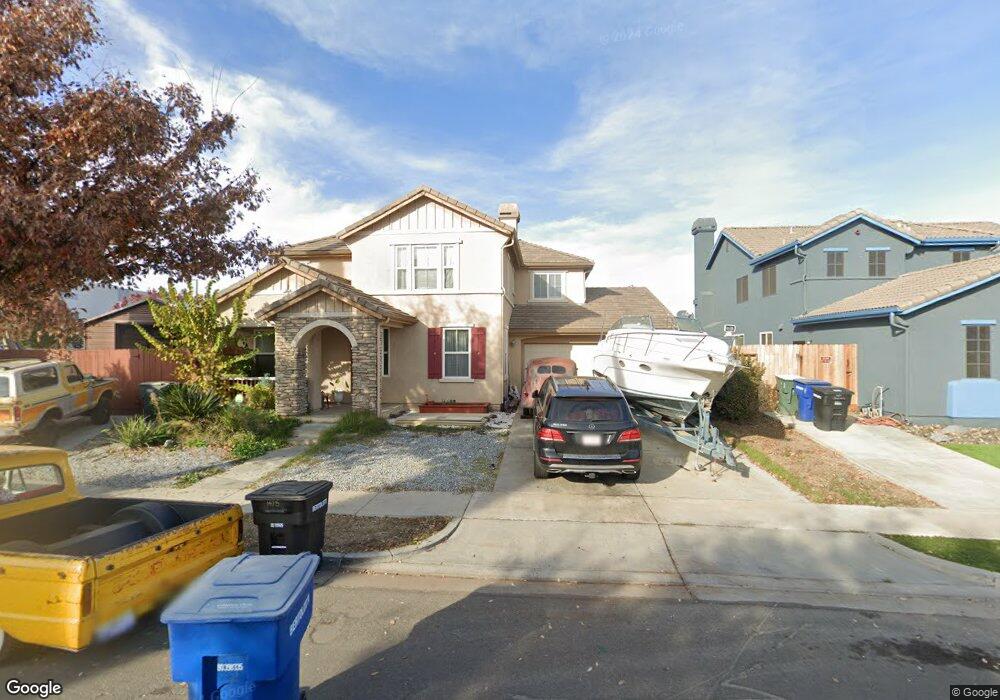
1473 Shearwater Dr Patterson, CA 95363
Estimated Value: $582,000 - $638,000
5
Beds
4
Baths
3,251
Sq Ft
$188/Sq Ft
Est. Value
About This Home
This home is located at 1473 Shearwater Dr, Patterson, CA 95363 and is currently estimated at $611,617, approximately $188 per square foot. 1473 Shearwater Dr is a home located in Stanislaus County with nearby schools including Apricot Valley Elementary School, Creekside Middle School, and Patterson High School.
Ownership History
Date
Name
Owned For
Owner Type
Purchase Details
Closed on
Mar 6, 2015
Sold by
Sequra Therese Victoria
Bought by
Campos Alejandro G and Campos Claudia
Current Estimated Value
Home Financials for this Owner
Home Financials are based on the most recent Mortgage that was taken out on this home.
Original Mortgage
$265,109
Outstanding Balance
$201,392
Interest Rate
3.54%
Mortgage Type
FHA
Estimated Equity
$410,225
Purchase Details
Closed on
Apr 3, 2006
Sold by
Segura Therese Victoria
Bought by
Segura Therese Victoria
Purchase Details
Closed on
Dec 2, 2005
Sold by
Sabio Napamoceno S
Bought by
Sabio Napamoceno S and The Nepamoceno S Sabio Trust
Purchase Details
Closed on
May 5, 2005
Sold by
Richmond American Homes Of Ca Inc
Bought by
Sabio Nepamoceno S
Home Financials for this Owner
Home Financials are based on the most recent Mortgage that was taken out on this home.
Original Mortgage
$333,945
Interest Rate
5.87%
Mortgage Type
Fannie Mae Freddie Mac
Create a Home Valuation Report for This Property
The Home Valuation Report is an in-depth analysis detailing your home's value as well as a comparison with similar homes in the area
Home Values in the Area
Average Home Value in this Area
Purchase History
| Date | Buyer | Sale Price | Title Company |
|---|---|---|---|
| Campos Alejandro G | $270,000 | Old Republic Title Company | |
| Segura Therese Victoria | -- | None Available | |
| Sabio Napamoceno S | -- | -- | |
| Sabio Nepamoceno S | $531,000 | Chicago Title |
Source: Public Records
Mortgage History
| Date | Status | Borrower | Loan Amount |
|---|---|---|---|
| Open | Campos Alejandro G | $265,109 | |
| Previous Owner | Sabio Nepamoceno S | $333,945 |
Source: Public Records
Tax History Compared to Growth
Tax History
| Year | Tax Paid | Tax Assessment Tax Assessment Total Assessment is a certain percentage of the fair market value that is determined by local assessors to be the total taxable value of land and additions on the property. | Land | Improvement |
|---|---|---|---|---|
| 2025 | $7,350 | $324,490 | $72,106 | $252,384 |
| 2024 | $7,294 | $318,129 | $70,693 | $247,436 |
| 2023 | $7,331 | $311,892 | $69,307 | $242,585 |
| 2022 | $7,045 | $305,778 | $67,949 | $237,829 |
| 2021 | $6,914 | $299,783 | $66,617 | $233,166 |
| 2020 | $6,843 | $296,710 | $65,934 | $230,776 |
| 2019 | $6,739 | $290,893 | $64,642 | $226,251 |
| 2018 | $6,543 | $285,190 | $63,375 | $221,815 |
| 2017 | $6,507 | $279,599 | $62,133 | $217,466 |
| 2016 | $6,427 | $274,117 | $60,915 | $213,202 |
| 2015 | $6,877 | $326,500 | $41,500 | $285,000 |
| 2014 | $6,690 | $314,000 | $40,000 | $274,000 |
Source: Public Records
Map
Nearby Homes
- 1450 Steel Creek Dr
- 500 Ridge Creek Ln
- 1416 Shearwater Dr
- 1408 Mendocino Creek Dr
- 1419 Nubian St
- 1426 Nubian St
- 238 Romanov Ct
- 1369 Buckskin Way
- 1400 Cliff Swallow Dr
- 432 Meadow Creek Dr
- 1363 Snake Creek Dr
- 1428 Brahma St
- 1314 Sutter Creek Ct
- 1407 Dylan Creek Dr
- 1325 Beaver Creek Dr
- 1413 Angus St
- 1373 Cougar Creek Dr
- 41 Palomino Way
- 440 Eider Dr
- 1219 Wigeon Dr
- 1469 Shearwater Dr
- 1480 Mesa Creek Dr
- 1465 Shearwater Dr
- 1476 Mesa Creek Dr
- 1472 Shearwater Dr
- 1468 Shearwater Dr
- 451 Ridge Creek Ln
- 1472 Mesa Creek Dr
- 1461 Shearwater Dr
- 1464 Shearwater Dr
- 1468 Mesa Creek Dr
- 457 Ridge Creek Ln
- 1460 Shearwater Dr
- 1465 Mendocino Creek Dr
- 1457 Shearwater Dr
- 456 Ridge Creek Ln
- 337 Amador Creek Ln
- 463 Ridge Creek Ln
- 1461 Mendocino Creek Dr
- 1456 Shearwater Dr