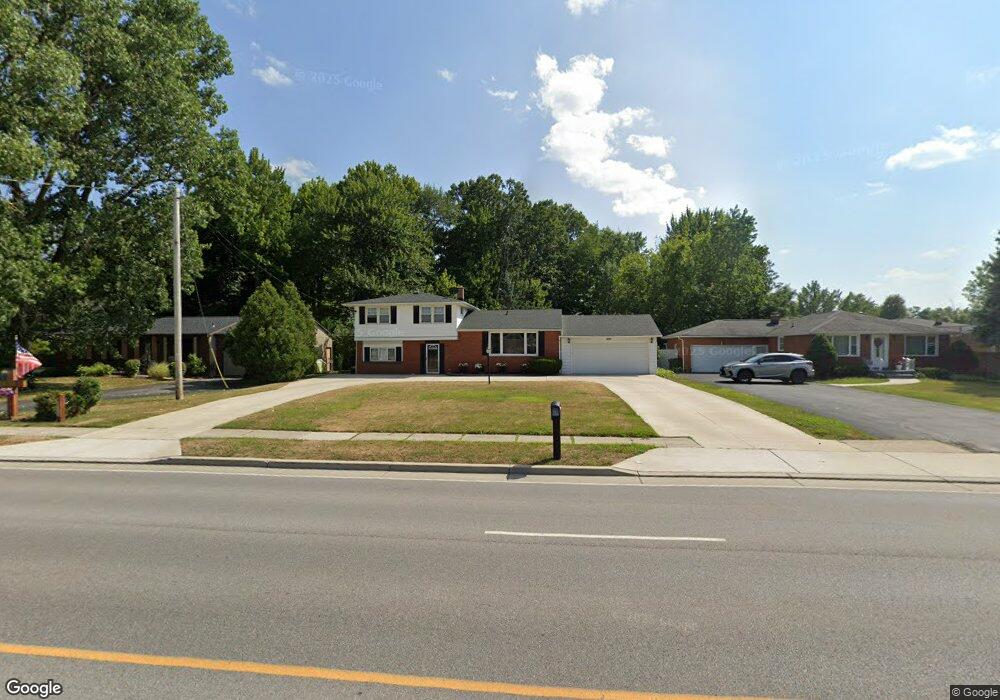
1475 Maple Rd Buffalo, NY 14221
South Amherst NeighborhoodEstimated Value: $367,541 - $485,000
3
Beds
2
Baths
2,175
Sq Ft
$186/Sq Ft
Est. Value
About This Home
This home is located at 1475 Maple Rd, Buffalo, NY 14221 and is currently estimated at $405,135, approximately $186 per square foot. 1475 Maple Rd is a home located in Erie County with nearby schools including Maple West Elementary School, Mill Middle School, and Williamsville South High School.
Ownership History
Date
Name
Owned For
Owner Type
Purchase Details
Closed on
Sep 16, 2009
Sold by
Zeshonski Chester and Zeshonski Margarita
Bought by
Fears Marcus L
Current Estimated Value
Home Financials for this Owner
Home Financials are based on the most recent Mortgage that was taken out on this home.
Original Mortgage
$127,000
Outstanding Balance
$83,436
Interest Rate
5.28%
Mortgage Type
New Conventional
Estimated Equity
$321,699
Purchase Details
Closed on
May 17, 2004
Sold by
Sirva Relocation Llc
Bought by
Zeshonski Chester and Zeshonski Margarita
Home Financials for this Owner
Home Financials are based on the most recent Mortgage that was taken out on this home.
Original Mortgage
$108,000
Interest Rate
5.88%
Mortgage Type
Purchase Money Mortgage
Purchase Details
Closed on
Mar 29, 2004
Sold by
Miller Cynthia M
Bought by
Sirva Relocation Llc
Home Financials for this Owner
Home Financials are based on the most recent Mortgage that was taken out on this home.
Original Mortgage
$108,000
Interest Rate
5.88%
Mortgage Type
Purchase Money Mortgage
Create a Home Valuation Report for This Property
The Home Valuation Report is an in-depth analysis detailing your home's value as well as a comparison with similar homes in the area
Home Values in the Area
Average Home Value in this Area
Purchase History
| Date | Buyer | Sale Price | Title Company |
|---|---|---|---|
| Fears Marcus L | $147,000 | First Amer Title Ins Co Ny | |
| Zeshonski Chester | $135,000 | -- | |
| Sirva Relocation Llc | $135,000 | -- |
Source: Public Records
Mortgage History
| Date | Status | Borrower | Loan Amount |
|---|---|---|---|
| Open | Fears Marcus L | $127,000 | |
| Closed | Fears Marcus L | $8,000 | |
| Previous Owner | Zeshonski Chester | $108,000 | |
| Previous Owner | Sirva Relocation Llc | $13,500 |
Source: Public Records
Tax History
| Year | Tax Paid | Tax Assessment Tax Assessment Total Assessment is a certain percentage of the fair market value that is determined by local assessors to be the total taxable value of land and additions on the property. | Land | Improvement |
|---|---|---|---|---|
| 2024 | $6,569 | $305,000 | $59,000 | $246,000 |
| 2023 | $5,569 | $156,279 | $45,000 | $111,279 |
| 2022 | $5,105 | $156,279 | $45,000 | $111,279 |
| 2021 | $4,986 | $155,000 | $45,000 | $110,000 |
| 2020 | $4,395 | $155,000 | $45,000 | $110,000 |
| 2019 | $5,850 | $155,000 | $45,000 | $110,000 |
| 2018 | $4,151 | $155,000 | $45,000 | $110,000 |
| 2017 | $2,021 | $155,000 | $45,000 | $110,000 |
| 2016 | $4,433 | $148,100 | $27,600 | $120,500 |
| 2015 | -- | $148,100 | $27,600 | $120,500 |
| 2014 | -- | $148,100 | $27,600 | $120,500 |
Source: Public Records
Map
Nearby Homes
- 70 Hickory Hill Rd
- 78 Hickory Hill Rd
- 1370 Maple Rd Unit 1
- 1380 Maple Rd Unit 8
- 60 Patton Place
- 27 Hickory Hill Rd Unit H
- 153 Patton Place
- 1240 Youngs Rd Unit C
- 113 Belvoir Rd
- 97 Ponderosa Dr
- 1210 Youngs Rd Unit D
- 1075 Youngs Rd Unit H
- 1175 Youngs Rd Unit E
- 1155 Youngs Rd Unit A
- 53 Wickham Dr
- 362 Dan Troy Dr
- 40 Waterford Park
- 47 Birch Ln
- 23 Birch Ln
- 10 Woodpointe Run
Your Personal Tour Guide
Ask me questions while you tour the home.