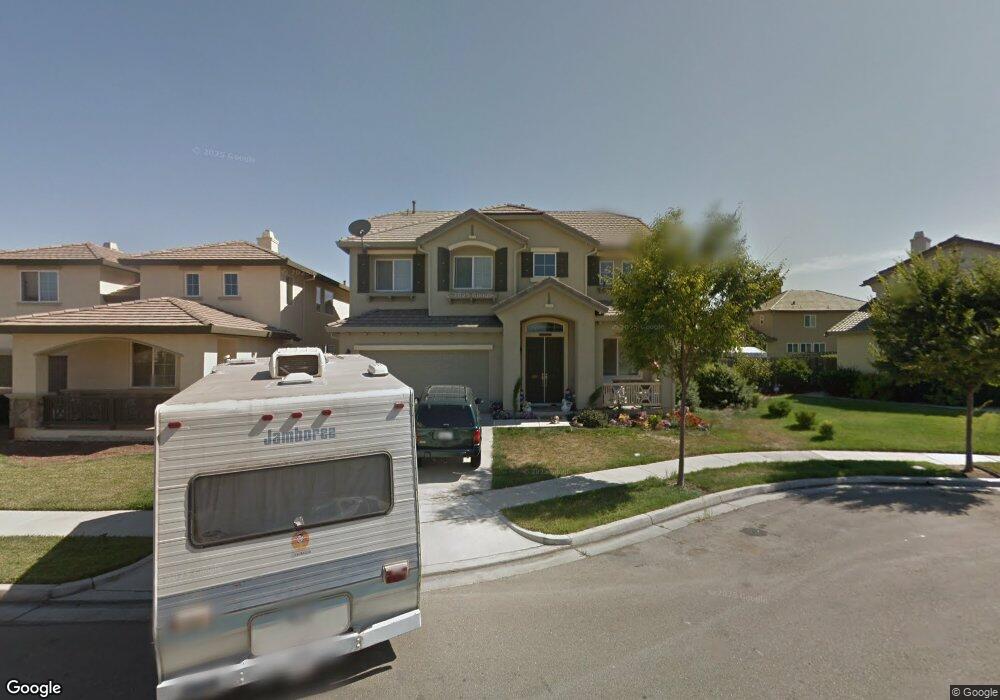
1476 Mesa Creek Dr Patterson, CA 95363
Estimated Value: $498,294 - $530,000
4
Beds
3
Baths
2,299
Sq Ft
$225/Sq Ft
Est. Value
About This Home
This home is located at 1476 Mesa Creek Dr, Patterson, CA 95363 and is currently estimated at $516,574, approximately $224 per square foot. 1476 Mesa Creek Dr is a home located in Stanislaus County with nearby schools including Apricot Valley Elementary School, Creekside Middle School, and Patterson High School.
Ownership History
Date
Name
Owned For
Owner Type
Purchase Details
Closed on
Jun 13, 2013
Sold by
Lindstrom Judy Rae
Bought by
The Entrust Group Inc and Mulugeta Kahsay Berhe Ira #61-00159
Current Estimated Value
Purchase Details
Closed on
May 15, 2009
Sold by
Gmac Mortgage Llc
Bought by
Lindstrom Judy Rae
Purchase Details
Closed on
Jul 21, 2008
Sold by
Dhank Bharti
Bought by
Gmac Mortgage Llc and Gmac Mortgage Corp
Purchase Details
Closed on
Jun 9, 2005
Sold by
Dhanik Yogendra
Bought by
Dhanik Bharti
Purchase Details
Closed on
Feb 14, 2005
Sold by
Meritage Homes Of California
Bought by
Dhanik Bharti
Home Financials for this Owner
Home Financials are based on the most recent Mortgage that was taken out on this home.
Original Mortgage
$359,650
Interest Rate
5.62%
Mortgage Type
Purchase Money Mortgage
Create a Home Valuation Report for This Property
The Home Valuation Report is an in-depth analysis detailing your home's value as well as a comparison with similar homes in the area
Home Values in the Area
Average Home Value in this Area
Purchase History
| Date | Buyer | Sale Price | Title Company |
|---|---|---|---|
| The Entrust Group Inc | $210,000 | North American Title Company | |
| Lindstrom Judy Rae | $157,000 | First American Title Company | |
| Gmac Mortgage Llc | $180,000 | First American Title Co | |
| Dhanik Bharti | -- | Chicago Title | |
| Dhanik Bharti | $472,500 | Chicago Title |
Source: Public Records
Mortgage History
| Date | Status | Borrower | Loan Amount |
|---|---|---|---|
| Previous Owner | Dhanik Bharti | $359,650 | |
| Closed | Dhanik Bharti | $112,644 |
Source: Public Records
Tax History Compared to Growth
Tax History
| Year | Tax Paid | Tax Assessment Tax Assessment Total Assessment is a certain percentage of the fair market value that is determined by local assessors to be the total taxable value of land and additions on the property. | Land | Improvement |
|---|---|---|---|---|
| 2025 | $6,593 | $258,587 | $49,250 | $209,337 |
| 2024 | $6,539 | $253,518 | $48,285 | $205,233 |
| 2023 | $6,594 | $248,548 | $47,339 | $201,209 |
| 2022 | $6,350 | $243,675 | $46,411 | $197,264 |
| 2021 | $6,208 | $238,898 | $45,501 | $193,397 |
| 2020 | $6,158 | $236,449 | $45,035 | $191,414 |
| 2019 | $6,065 | $231,813 | $44,152 | $187,661 |
| 2018 | $5,902 | $227,269 | $43,287 | $183,982 |
| 2017 | $5,880 | $222,814 | $42,439 | $180,375 |
| 2016 | $5,817 | $218,446 | $41,607 | $176,839 |
| 2015 | $5,732 | $215,166 | $40,983 | $174,183 |
| 2014 | $5,640 | $210,952 | $40,181 | $170,771 |
Source: Public Records
Map
Nearby Homes
- 1450 Steel Creek Dr
- 500 Ridge Creek Ln
- 1416 Shearwater Dr
- 1408 Mendocino Creek Dr
- 1419 Nubian St
- 1426 Nubian St
- 238 Romanov Ct
- 1400 Cliff Swallow Dr
- 1369 Buckskin Way
- 432 Meadow Creek Dr
- 1363 Snake Creek Dr
- 1314 Sutter Creek Ct
- 1407 Dylan Creek Dr
- 1428 Brahma St
- 1325 Beaver Creek Dr
- 1373 Cougar Creek Dr
- 1413 Angus St
- 41 Palomino Way
- 1224 Kingfisher Dr
- 440 Eider Dr
- 1472 Mesa Creek Dr
- 1480 Mesa Creek Dr
- 1465 Shearwater Dr
- 1469 Shearwater Dr
- 1468 Mesa Creek Dr
- 1461 Shearwater Dr
- 451 Ridge Creek Ln
- 1473 Shearwater Dr
- 456 Ridge Creek Ln
- 457 Ridge Creek Ln
- 1457 Shearwater Dr
- 462 Ridge Creek Ln
- 457 Leather Creek Ln
- 463 Ridge Creek Ln
- 463 Leather Creek Ln
- 1468 Shearwater Dr
- 468 Ridge Creek Ln
- 1464 Shearwater Dr
- 1460 Shearwater Dr
- 1472 Shearwater Dr