M
Seller's Agent in 2018
Maria Araujo
White House Realty
(508) 677-3666
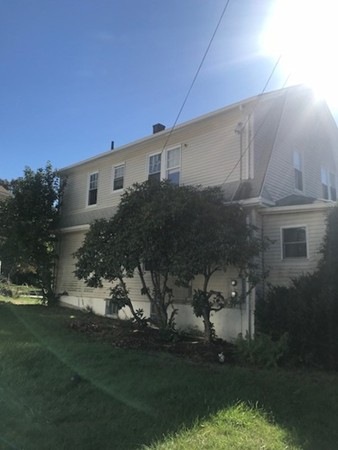
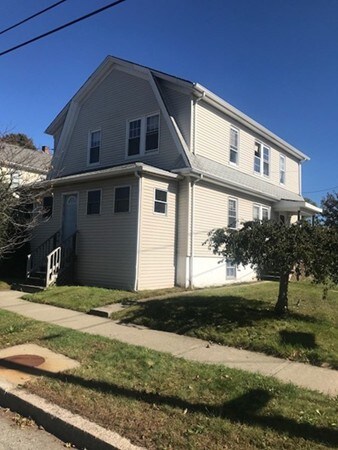
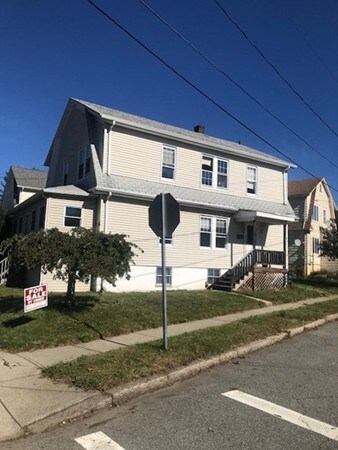
property needs kitchens , heating systems and bathrooms and paint. excellent location ,has additional parcel for parking
Last Agent to Sell the Property
Keller Williams South Watuppa Listed on: 10/18/2017

Last Buyer's Agent
Maria Araujo
White House Realty
| Date | Status | Loan Amount | Loan Type |
|---|---|---|---|
| Closed | $188,000 | Stand Alone Refi Refinance Of Original Loan | |
| Closed | $222,500 | New Conventional | |
| Closed | $150,000 | Unknown |
| Date | Event | Price | Change | Sq Ft Price |
|---|---|---|---|---|
| 11/30/2018 11/30/18 | Sold | $310,000 | -5.8% | $175 / Sq Ft |
| 10/29/2018 10/29/18 | Pending | -- | -- | -- |
| 10/16/2018 10/16/18 | Price Changed | $329,000 | -2.9% | $186 / Sq Ft |
| 09/19/2018 09/19/18 | Price Changed | $339,000 | -2.9% | $192 / Sq Ft |
| 08/09/2018 08/09/18 | Price Changed | $349,000 | -10.5% | $197 / Sq Ft |
| 07/17/2018 07/17/18 | Price Changed | $389,900 | -2.5% | $221 / Sq Ft |
| 07/16/2018 07/16/18 | For Sale | $399,900 | +185.6% | $226 / Sq Ft |
| 02/28/2018 02/28/18 | Sold | $140,000 | -15.1% | $79 / Sq Ft |
| 01/19/2018 01/19/18 | Pending | -- | -- | -- |
| 12/30/2017 12/30/17 | Price Changed | $164,900 | -2.9% | $93 / Sq Ft |
| 12/11/2017 12/11/17 | Price Changed | $169,900 | -5.6% | $96 / Sq Ft |
| 12/08/2017 12/08/17 | For Sale | $179,900 | +28.5% | $102 / Sq Ft |
| 12/04/2017 12/04/17 | Off Market | $140,000 | -- | -- |
| 11/22/2017 11/22/17 | Price Changed | $179,900 | -5.3% | $102 / Sq Ft |
| 10/28/2017 10/28/17 | Price Changed | $189,900 | -5.0% | $107 / Sq Ft |
| 10/20/2017 10/20/17 | Price Changed | $199,900 | -9.1% | $113 / Sq Ft |
| 10/18/2017 10/18/17 | For Sale | $219,900 | -- | $124 / Sq Ft |
| Year | Tax Paid | Tax Assessment Tax Assessment Total Assessment is a certain percentage of the fair market value that is determined by local assessors to be the total taxable value of land and additions on the property. | Land | Improvement |
|---|---|---|---|---|
| 2025 | $6,110 | $533,600 | $120,800 | $412,800 |
| 2024 | $5,596 | $487,000 | $116,200 | $370,800 |
| 2023 | $5,119 | $417,200 | $112,000 | $305,200 |
| 2022 | $4,462 | $373,100 | $103,700 | $269,400 |
| 2021 | $4,462 | $322,600 | $106,800 | $215,800 |
| 2020 | $4,399 | $304,400 | $106,800 | $197,600 |
| 2019 | $3,084 | $211,500 | $99,700 | $111,800 |
| 2018 | $2,947 | $201,600 | $103,400 | $98,200 |
| 2017 | $2,587 | $184,800 | $92,000 | $92,800 |
| 2016 | $2,487 | $182,500 | $92,000 | $90,500 |
| 2015 | $2,384 | $182,300 | $91,800 | $90,500 |
| 2014 | $2,394 | $190,300 | $91,800 | $98,500 |
M
Seller's Agent in 2018
Maria Araujo
White House Realty
(508) 677-3666
T
Seller's Agent in 2018
The Andrade Team
Keller Williams South Watuppa
(508) 730-7131
1 in this area
22 Total Sales
Source: MLS Property Information Network (MLS PIN)
MLS Number: 72244566
APN: FALL-000012T-000000-000018
Disclaimer: Certain information contained herein is derived from information provided by parties other than Homes.com. All information provided is deemed reliable, but is not guaranteed to be accurate and should be independently verified.
![]() The property listing data and information, or the Images, set forth herein were provided to MLS Property Information Network, Inc. from third party sources, including sellers, lessors and public records, and were compiled by MLS Property Information Network, Inc. The property listing data and information, and the Images, are for the personal, non-commercial use of consumers having a good faith interest in purchasing or leasing listed properties of the type displayed to them and may not be used for any purpose other than to identify prospective properties which such consumers may have a good faith interest in purchasing or leasing. MLS Property Information Network, Inc. and its subscribers disclaim any and all representations and warranties as to the accuracy of the property listing data and information, or as to the accuracy of any of the Images, set forth herein.
The property listing data and information, or the Images, set forth herein were provided to MLS Property Information Network, Inc. from third party sources, including sellers, lessors and public records, and were compiled by MLS Property Information Network, Inc. The property listing data and information, and the Images, are for the personal, non-commercial use of consumers having a good faith interest in purchasing or leasing listed properties of the type displayed to them and may not be used for any purpose other than to identify prospective properties which such consumers may have a good faith interest in purchasing or leasing. MLS Property Information Network, Inc. and its subscribers disclaim any and all representations and warranties as to the accuracy of the property listing data and information, or as to the accuracy of any of the Images, set forth herein.