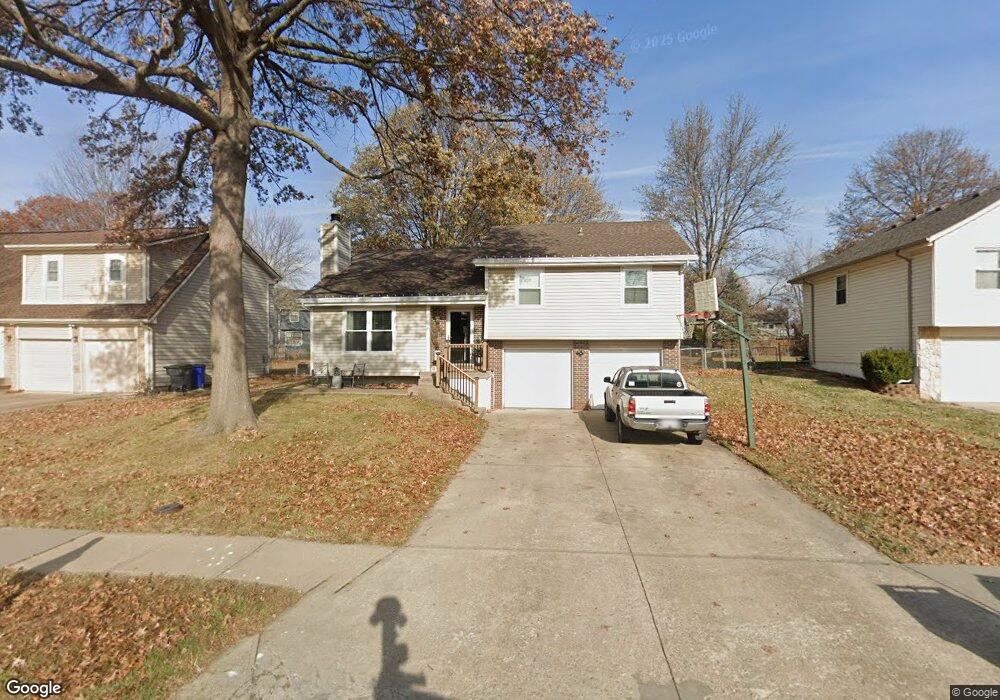
14804 W 149th Ct Olathe, KS 66062
Estimated Value: $327,204 - $344,000
3
Beds
3
Baths
1,135
Sq Ft
$295/Sq Ft
Est. Value
About This Home
This home is located at 14804 W 149th Ct, Olathe, KS 66062 and is currently estimated at $335,051, approximately $295 per square foot. 14804 W 149th Ct is a home located in Johnson County with nearby schools including Green Springs Elementary School, Frontier Trail Middle School, and Olathe South Sr High School.
Ownership History
Date
Name
Owned For
Owner Type
Purchase Details
Closed on
May 9, 2006
Sold by
Hull Johnny A and Hull Tamera L
Bought by
Creamer Brett J and Creamer Kelli D
Current Estimated Value
Home Financials for this Owner
Home Financials are based on the most recent Mortgage that was taken out on this home.
Original Mortgage
$32,600
Interest Rate
6.14%
Mortgage Type
Stand Alone Second
Purchase Details
Closed on
Jul 16, 2001
Sold by
Hill Ralph S and Hill Linda S
Bought by
Hull Johnny A and Hull Tamera L
Home Financials for this Owner
Home Financials are based on the most recent Mortgage that was taken out on this home.
Original Mortgage
$124,400
Interest Rate
7.18%
Create a Home Valuation Report for This Property
The Home Valuation Report is an in-depth analysis detailing your home's value as well as a comparison with similar homes in the area
Home Values in the Area
Average Home Value in this Area
Purchase History
| Date | Buyer | Sale Price | Title Company |
|---|---|---|---|
| Creamer Brett J | -- | None Available | |
| Hull Johnny A | -- | Security Land Title Company |
Source: Public Records
Mortgage History
| Date | Status | Borrower | Loan Amount |
|---|---|---|---|
| Closed | Creamer Brett J | $32,600 | |
| Open | Creamer Brett J | $130,400 | |
| Previous Owner | Hull Johnny A | $124,400 |
Source: Public Records
Tax History Compared to Growth
Tax History
| Year | Tax Paid | Tax Assessment Tax Assessment Total Assessment is a certain percentage of the fair market value that is determined by local assessors to be the total taxable value of land and additions on the property. | Land | Improvement |
|---|---|---|---|---|
| 2024 | $3,805 | $34,155 | $6,259 | $27,896 |
| 2023 | $3,791 | $33,223 | $5,698 | $27,525 |
| 2022 | $3,446 | $29,405 | $5,698 | $23,707 |
| 2021 | $3,371 | $27,335 | $4,953 | $22,382 |
| 2020 | $3,156 | $25,380 | $4,953 | $20,427 |
| 2019 | $2,927 | $23,403 | $4,323 | $19,080 |
| 2018 | $2,840 | $22,552 | $4,322 | $18,230 |
| 2017 | $2,686 | $21,125 | $3,920 | $17,205 |
| 2016 | $2,420 | $19,550 | $3,601 | $15,949 |
| 2015 | $2,309 | $18,676 | $3,601 | $15,075 |
| 2013 | -- | $17,204 | $3,601 | $13,603 |
Source: Public Records
Map
Nearby Homes
- 14776 S Alden St
- 14813 W 150th Place
- 15263 W 147th Dr
- 14551 S Mullen St
- 14232 W 151st Terrace Unit 500
- 15234 S Albervan St
- 15500 W 152nd St
- 15150 W 153rd St
- 15201 S Blackfoot Dr
- 14064 W 147th St
- 14805 S Brougham Dr
- 15374 S Greenwood St
- 14274 W 155th St
- 13974 W 147th St
- 13844 W 153rd Ct
- 13459 W 148th Cir
- 15607 S Blackfoot St
- 15129 S Locust St
- 15763 W 154th Terrace
- 15132 W 156th Terrace
- 14808 W 149th Ct
- 14800 W 149th Ct
- 14812 W 149th Ct
- 14712 W 149th Ct
- 14817 W 149th St
- 14811 W 149th St
- 14807 W 149th St
- 14803 W 149th St
- 14900 W 149th Ct
- 14805 W 149th Ct
- 14809 W 149th Ct
- 14708 W 149th Ct
- 14801 W 149th Ct
- 14715 W 149th St
- 14813 W 149th Ct
- 14715 W 149th St
- 14901 W 149th Ct
- 14711 W 149th St
- 14704 W 149th Ct
- 14709 W 149th Ct