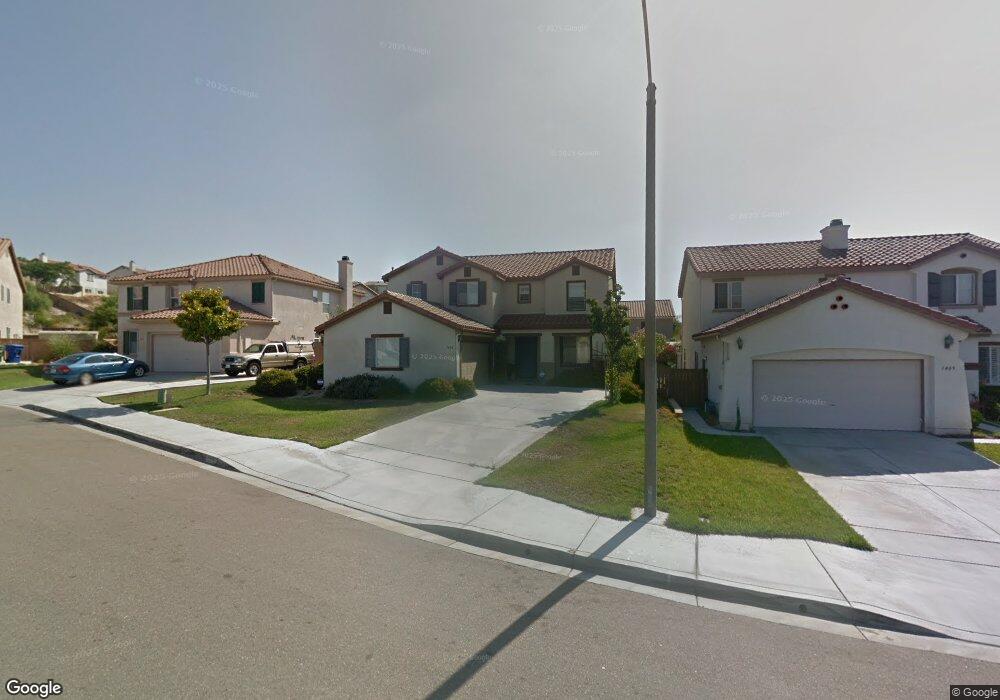
1485 Tridle Place Chula Vista, CA 91911
Estimated Value: $1,065,314 - $1,163,000
4
Beds
3
Baths
2,863
Sq Ft
$391/Sq Ft
Est. Value
About This Home
This home is located at 1485 Tridle Place, Chula Vista, CA 91911 and is currently estimated at $1,119,579, approximately $391 per square foot. 1485 Tridle Place is a home located in San Diego County with nearby schools including Anne & William Hedenkamp Elementary School, Rancho Del Rey Middle School, and Otay Ranch Senior High School.
Ownership History
Date
Name
Owned For
Owner Type
Purchase Details
Closed on
Oct 28, 2010
Sold by
Chut Felipe B Yee and Chut Ludivinia Yee
Bought by
Chut Felipe B Yee and Chut Ludivinia R Yee
Current Estimated Value
Home Financials for this Owner
Home Financials are based on the most recent Mortgage that was taken out on this home.
Original Mortgage
$205,000
Outstanding Balance
$3,084
Interest Rate
4.33%
Mortgage Type
New Conventional
Estimated Equity
$1,116,495
Purchase Details
Closed on
Jan 27, 2007
Sold by
Chut Felipe B Yee and Chut Ludivinia R Yee
Bought by
Chut Felipe B Yee and Chut Ludivinia R Yee
Purchase Details
Closed on
May 3, 2001
Sold by
Kb Home Coastal Inc
Bought by
Yeechut Felipe B and Yeechut Ludivinia R
Home Financials for this Owner
Home Financials are based on the most recent Mortgage that was taken out on this home.
Original Mortgage
$272,250
Interest Rate
7.21%
Create a Home Valuation Report for This Property
The Home Valuation Report is an in-depth analysis detailing your home's value as well as a comparison with similar homes in the area
Purchase History
| Date | Buyer | Sale Price | Title Company |
|---|---|---|---|
| Chut Felipe B Yee | -- | Accommodation | |
| Yee Chut Felipe B | -- | Fidelity National Title Co | |
| Chut Felipe B Yee | -- | None Available | |
| Yeechut Felipe B | $340,500 | First American Title |
Source: Public Records
Mortgage History
| Date | Status | Borrower | Loan Amount |
|---|---|---|---|
| Open | Yee Chut Felipe B | $205,000 | |
| Previous Owner | Yeechut Felipe B | $272,250 |
Source: Public Records
Tax History
| Year | Tax Paid | Tax Assessment Tax Assessment Total Assessment is a certain percentage of the fair market value that is determined by local assessors to be the total taxable value of land and additions on the property. | Land | Improvement |
|---|---|---|---|---|
| 2025 | $9,151 | $502,786 | $169,878 | $332,908 |
| 2024 | $9,151 | $492,929 | $166,548 | $326,381 |
| 2023 | $8,984 | $483,265 | $163,283 | $319,982 |
| 2022 | $8,732 | $473,790 | $160,082 | $313,708 |
| 2021 | $8,564 | $464,501 | $156,944 | $307,557 |
| 2020 | $8,377 | $459,739 | $155,335 | $304,404 |
| 2019 | $8,202 | $450,726 | $152,290 | $298,436 |
| 2018 | $8,140 | $441,889 | $149,304 | $292,585 |
| 2017 | $8,003 | $433,226 | $146,377 | $286,849 |
| 2016 | $7,830 | $424,732 | $143,507 | $281,225 |
| 2015 | $7,657 | $418,353 | $141,352 | $277,001 |
| 2014 | $7,700 | $410,159 | $138,584 | $271,575 |
Source: Public Records
Map
Nearby Homes
- 788 Callecita Aquilla Sur
- 1519 Taber Dr
- 769 Mateo St Unit 1
- 789 Mateo St Unit 2
- 808 Mateo St Unit 6
- 821 Mateo St Unit 1
- 760 Jilian St Unit 1
- 766 Jilian St Unit 2
- 841 Hana Ave Unit 1
- 796 Makani St Unit 3
- 972 Merced River Rd
- 1233 Equinox Way
- 857 Cheyne Loop Unit 3
- 843 Caminito Las Olas
- 940 Sullivan Ct
- 1560 Cavern Point Ct
- 1565 San Pedro Point Ct
- 1357 Santa Olivia Rd
- 1512 Concord Way
- 1201 Halley Ct
- 1489 Tridle Place
- 1481 Tridle Place
- 1493 Tridle Place
- 1480 Bradley Place
- 1484 Bradley Place
- 1488 Bradley Place
- 1476 Bradley Place
- 1497 Tridle Place
- 1492 Bradley Place
- 1477 Tridle Place
- 1484 Tridle Place
- 1488 Tridle Place
- 1472 Tridle Place
- 1492 Tridle Place
- 1480 Tridle Place
- 1496 Bradley Place
- 1501 Tridle Place
- 1472 Bradley Place
- 1476 Tridle Place
- 1496 Tridle Place
Your Personal Tour Guide
Ask me questions while you tour the home.