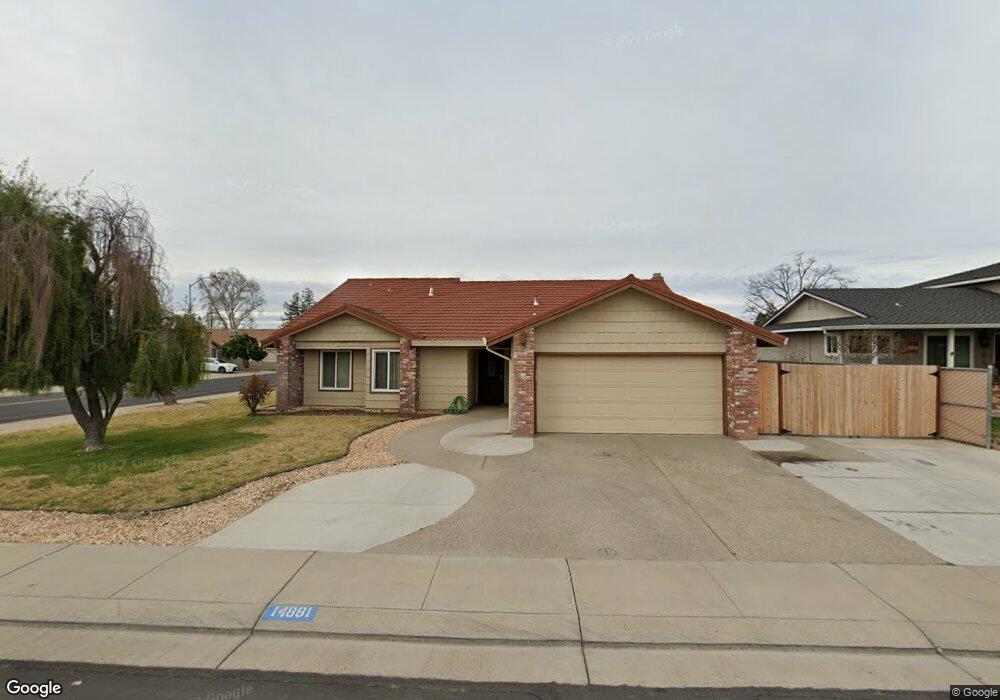
14881 Seminole Way Manteca, CA 95336
Estimated Value: $456,000 - $570,488
4
Beds
3
Baths
1,836
Sq Ft
$292/Sq Ft
Est. Value
About This Home
This home is located at 14881 Seminole Way, Manteca, CA 95336 and is currently estimated at $536,622, approximately $292 per square foot. 14881 Seminole Way is a home located in San Joaquin County with nearby schools including New Haven Elementary School and East Union High School.
Ownership History
Date
Name
Owned For
Owner Type
Purchase Details
Closed on
Jun 27, 2016
Sold by
Growing Economy Corp
Bought by
Siliga Eveline Pasa and Collins Michele Leniece
Current Estimated Value
Home Financials for this Owner
Home Financials are based on the most recent Mortgage that was taken out on this home.
Original Mortgage
$339,285
Outstanding Balance
$269,003
Interest Rate
3.37%
Mortgage Type
FHA
Estimated Equity
$267,619
Purchase Details
Closed on
Aug 20, 2015
Sold by
The Bank Of New York Mellon Corporation
Bought by
Growing Economy Corp
Purchase Details
Closed on
Jul 15, 2015
Sold by
Torres Ruben L and Torres Venus D
Bought by
The Bank Of New York Mellon Corporation
Purchase Details
Closed on
Oct 4, 2005
Sold by
Montoya Adolph L and Montoya Kathleen A
Bought by
Torres Ruben L and Torres Venus D
Home Financials for this Owner
Home Financials are based on the most recent Mortgage that was taken out on this home.
Original Mortgage
$359,960
Interest Rate
2.5%
Mortgage Type
Negative Amortization
Create a Home Valuation Report for This Property
The Home Valuation Report is an in-depth analysis detailing your home's value as well as a comparison with similar homes in the area
Home Values in the Area
Average Home Value in this Area
Purchase History
| Date | Buyer | Sale Price | Title Company |
|---|---|---|---|
| Siliga Eveline Pasa | $351,000 | Fidelity National Title Co | |
| Growing Economy Corp | $248,000 | Title365 Company | |
| The Bank Of New York Mellon Corporation | $322,399 | None Available | |
| Torres Ruben L | $450,000 | Alliance Title Co |
Source: Public Records
Mortgage History
| Date | Status | Borrower | Loan Amount |
|---|---|---|---|
| Open | Siliga Eveline Pasa | $339,285 | |
| Previous Owner | Torres Ruben L | $359,960 |
Source: Public Records
Tax History Compared to Growth
Tax History
| Year | Tax Paid | Tax Assessment Tax Assessment Total Assessment is a certain percentage of the fair market value that is determined by local assessors to be the total taxable value of land and additions on the property. | Land | Improvement |
|---|---|---|---|---|
| 2025 | $6,184 | $415,508 | $145,605 | $269,903 |
| 2024 | $6,043 | $407,361 | $142,750 | $264,611 |
| 2023 | $5,954 | $399,374 | $139,951 | $259,423 |
| 2022 | $5,888 | $391,544 | $137,207 | $254,337 |
| 2021 | $5,837 | $383,867 | $134,517 | $249,350 |
| 2020 | $5,662 | $379,932 | $133,138 | $246,794 |
| 2019 | $5,608 | $372,483 | $130,528 | $241,955 |
| 2018 | $5,548 | $365,180 | $127,969 | $237,211 |
| 2017 | $5,459 | $358,020 | $125,460 | $232,560 |
| 2016 | $4,201 | $247,800 | $100,000 | $147,800 |
| 2015 | $4,568 | $282,000 | $112,000 | $170,000 |
| 2014 | -- | $266,000 | $106,000 | $160,000 |
Source: Public Records
Map
Nearby Homes
- 6236 Choctaw Ct
- 14665 Cree Ct
- 5958 E Lathrop Rd
- 1052 Camborne Dr
- 5862 Northland Rd
- 1624 S Frontage Rd Unit 21
- 1624 S Frontage Rd Unit 81
- 7001 Southland Rd
- 753 Conrad St
- 771 Conrad St
- 137 Quarry Stone Way
- 6288 E Lathrop Rd
- 732 Conrad Ct
- 732 Conrad St
- 762 Conrad St
- 484 Pinehurst St
- 1340 Crimson Place
- Residence 1 Plan at Origin at The Collective 55+
- Residence 2 Plan at Origin at The Collective 55+
- 2021 Holbrook Place
- 14871 Seminole Way
- 6235 Blackfoot Way
- 6248 Blackfoot Way
- 6258 Blackfoot Way
- 6225 Blackfoot Way
- 14888 Seminole Way
- 14878 Seminole Way
- 6226 Choctaw Ct
- 6238 Blackfoot Way
- 14851 Seminole Way
- 6268 Blackfoot Way
- 14898 Seminole Way
- 14868 Seminole Way
- 6215 Blackfoot Way
- 6228 Blackfoot Way
- 6216 Choctaw Ct
- 14858 Seminole Way
- 14841 Seminole Way
- 6218 Blackfoot Way
- 6205 Blackfoot Way