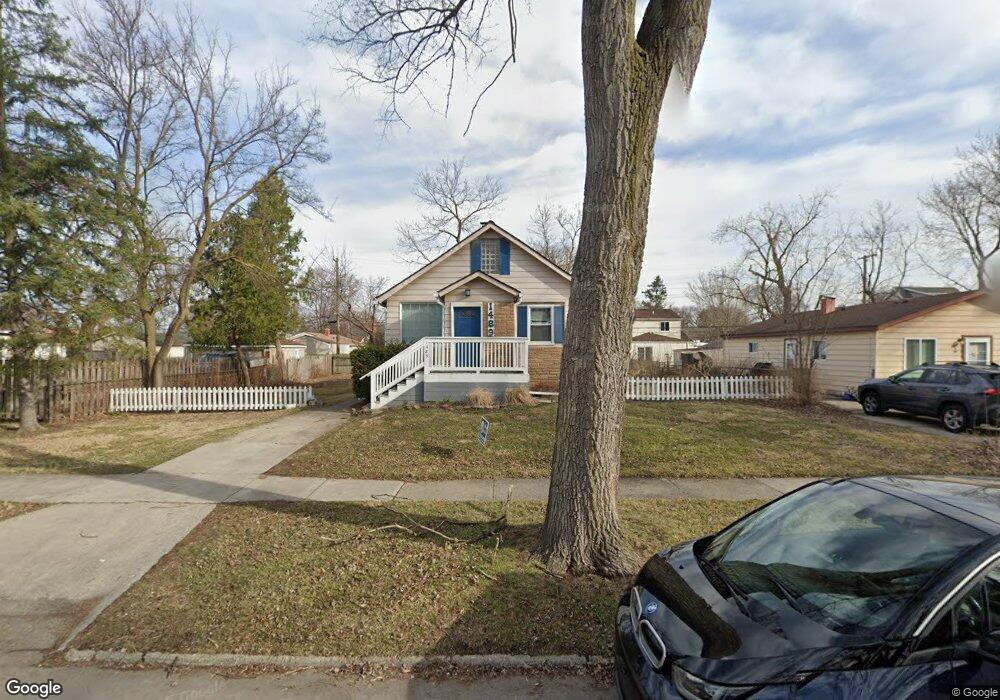
1489 Camden St Unit Bldg-Unit Ferndale, MI 48220
Estimated Value: $237,186 - $252,000
3
Beds
2
Baths
1,240
Sq Ft
$197/Sq Ft
Est. Value
About This Home
This home is located at 1489 Camden St Unit Bldg-Unit, Ferndale, MI 48220 and is currently estimated at $244,797, approximately $197 per square foot. 1489 Camden St Unit Bldg-Unit is a home located in Oakland County with nearby schools including Hazel Park Junior High School and Hazel Park High School.
Ownership History
Date
Name
Owned For
Owner Type
Purchase Details
Closed on
Jun 28, 2024
Sold by
Cheung Conan D and Lin Mei Fang
Bought by
Crable John R
Current Estimated Value
Purchase Details
Closed on
Jan 11, 2018
Sold by
Golovich John
Bought by
Cheung Conan U and Lin Mei Fang
Purchase Details
Closed on
Jun 17, 2008
Sold by
Us Bank Na
Bought by
Golovich John
Purchase Details
Closed on
Nov 13, 2007
Sold by
Merski Mark
Bought by
Wells Fargo Bank Na
Purchase Details
Closed on
Aug 9, 2003
Sold by
Becker Gary and Harder Barbara A
Bought by
Merski Mark
Create a Home Valuation Report for This Property
The Home Valuation Report is an in-depth analysis detailing your home's value as well as a comparison with similar homes in the area
Home Values in the Area
Average Home Value in this Area
Purchase History
| Date | Buyer | Sale Price | Title Company |
|---|---|---|---|
| Crable John R | $240,000 | None Listed On Document | |
| Cheung Conan U | $111,600 | Michigan Title Insurance Age | |
| Golovich John | $24,500 | Attorneys Title | |
| Wells Fargo Bank Na | $115,418 | None Available | |
| Merski Mark | $130,000 | Crossroads Title |
Source: Public Records
Tax History Compared to Growth
Tax History
| Year | Tax Paid | Tax Assessment Tax Assessment Total Assessment is a certain percentage of the fair market value that is determined by local assessors to be the total taxable value of land and additions on the property. | Land | Improvement |
|---|---|---|---|---|
| 2024 | $4,612 | $102,980 | $0 | $0 |
| 2023 | $4,754 | $87,650 | $0 | $0 |
| 2022 | $4,773 | $79,700 | $0 | $0 |
| 2021 | $4,662 | $68,850 | $0 | $0 |
| 2020 | $4,777 | $58,900 | $0 | $0 |
| 2019 | $4,799 | $52,850 | $0 | $0 |
| 2018 | $3,019 | $42,460 | $0 | $0 |
| 2017 | $2,959 | $40,590 | $0 | $0 |
| 2016 | $3,258 | $38,130 | $0 | $0 |
| 2015 | -- | $36,350 | $0 | $0 |
| 2014 | -- | $32,940 | $0 | $0 |
| 2011 | -- | $46,120 | $0 | $0 |
Source: Public Records
Map
Nearby Homes
- 1460 E Chesterfield St
- 419 W Bernhard Ave
- 382 W Hayes Ave
- 338 W Hayes Ave
- 449 W Evelyn Ave
- 0000 W Milton Ave
- 76 W Bernhard Ave
- 000 W Muir Ave
- 426 Alameda St
- 152 W Muir Ave
- 404 W Madge Ave
- 1811 E Marshall St
- 764 Spencer St
- 39 W Elza Ave
- 20322 Charleston St
- 1772 University St
- 0000 E Muir Ave
- 615 E Webster St
- 631 Spencer St
- 32 E George Ave
- 1489 Camden St
- 1453 Camden St
- 1505 Camden St
- 1460 E Webster St
- 1478 E Webster St
- 1521 Camden St
- 1498 E Webster St
- 1448 E Webster St
- 1510 E Webster St
- 1431 Camden St
- 1432 E Webster St
- 1530 E Webster St
- 1421 Camden St
- 1480 Camden St
- 1416 E Webster St
- 1460 Camden St
- 1559 Camden St
- 1510 Camden St
- 1558 E Webster St
- 1520 Camden St