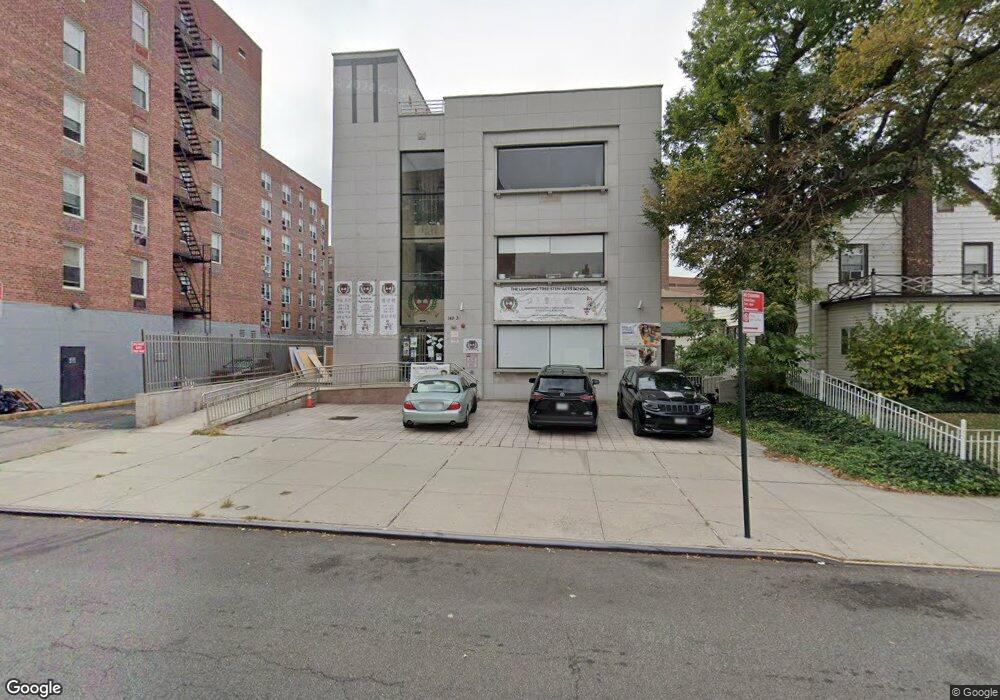
14934 35th Ave Flushing, NY 11354
Murray Hill-Broadway NeighborhoodEstimated Value: $5,477,900
Studio
--
Bath
8,944
Sq Ft
$612/Sq Ft
Est. Value
About This Home
This home is located at 14934 35th Ave, Flushing, NY 11354 and is currently estimated at $5,477,900, approximately $612 per square foot. 14934 35th Ave is a home located in Queens County with nearby schools including P.S. 21 Edward Hart, Jhs 185 Edward Bleeker, and Flushing High School.
Ownership History
Date
Name
Owned For
Owner Type
Purchase Details
Closed on
Mar 20, 2013
Sold by
Northern Grove Llc
Bought by
Functional Life Achievement Inc
Current Estimated Value
Purchase Details
Closed on
Oct 6, 2011
Sold by
A & R 35 Inc
Bought by
Northern Grove Llc
Purchase Details
Closed on
Apr 9, 2010
Sold by
A & R Ny Inc
Bought by
A & R 35 Inc
Purchase Details
Closed on
Jan 14, 2009
Sold by
Ham Hyun and Park Cheon
Bought by
A & R Ny Inc
Purchase Details
Closed on
Sep 10, 2002
Sold by
Daejin Ny Inc
Bought by
Park Cheon and Ham Hyun
Home Financials for this Owner
Home Financials are based on the most recent Mortgage that was taken out on this home.
Original Mortgage
$375,200
Interest Rate
6.09%
Mortgage Type
Commercial
Purchase Details
Closed on
Oct 31, 2001
Sold by
Ng Shui-Kei and Ng Meichun
Bought by
Daejin Ny Inc
Home Financials for this Owner
Home Financials are based on the most recent Mortgage that was taken out on this home.
Original Mortgage
$286,500
Interest Rate
6.67%
Mortgage Type
Commercial
Create a Home Valuation Report for This Property
The Home Valuation Report is an in-depth analysis detailing your home's value as well as a comparison with similar homes in the area
Home Values in the Area
Average Home Value in this Area
Purchase History
| Date | Buyer | Sale Price | Title Company |
|---|---|---|---|
| Functional Life Achievement Inc | $3,075,000 | -- | |
| Northern Grove Llc | $3,150,000 | -- | |
| A & R 35 Inc | -- | -- | |
| A & R Ny Inc | -- | -- | |
| Park Cheon | -- | -- | |
| Daejin Ny Inc | -- | -- |
Source: Public Records
Mortgage History
| Date | Status | Borrower | Loan Amount |
|---|---|---|---|
| Previous Owner | Park Cheon | $375,200 | |
| Previous Owner | Daejin Ny Inc | $286,500 |
Source: Public Records
Tax History
| Year | Tax Paid | Tax Assessment Tax Assessment Total Assessment is a certain percentage of the fair market value that is determined by local assessors to be the total taxable value of land and additions on the property. | Land | Improvement |
|---|---|---|---|---|
| 2025 | -- | $1,903,500 | $405,000 | $1,498,500 |
| 2024 | -- | $1,875,600 | $405,000 | $1,470,600 |
| 2023 | $0 | $1,837,800 | $367,200 | $1,470,600 |
| 2022 | $0 | $1,732,950 | $405,000 | $1,327,950 |
| 2021 | $0 | $1,589,850 | $405,000 | $1,184,850 |
| 2020 | $0 | $1,589,850 | $405,000 | $1,184,850 |
| 2019 | $0 | $1,400,850 | $216,000 | $1,184,850 |
| 2018 | $0 | $1,213,290 | $216,000 | $997,290 |
| 2017 | $0 | $1,158,480 | $216,000 | $942,480 |
| 2016 | -- | $1,158,480 | $216,000 | $942,480 |
| 2015 | $51,349 | $1,080,540 | $216,000 | $864,540 |
| 2014 | $51,349 | $1,083,690 | $226,800 | $856,890 |
Source: Public Records
Map
Nearby Homes
- 35-10 150th St Unit 6A
- 37-10 149th Place Unit 3A
- 149-43 35 Ave Unit 3J
- 14943 35th Ave Unit 3I
- 149-06 Northern Blvd Unit 501
- 149-06 Northern Blvd Unit 304
- 149-06 Northern Blvd Unit 407
- 149-06 Northern Blvd Unit 302
- 150-02 Northern Blvd Unit 3C
- 150-02 Northern Blvd Unit 6H
- 150-02 Northern Blvd Unit 6E
- 150-02 Northern Blvd Unit 6A
- 150-02 Northern Blvd Unit 3L
- 150-02 Northern Blvd Unit 6C
- 150-02 Northern Blvd Unit 3H
- 150-02 Northern Blvd Unit 3E
- 150-02 Northern Blvd Unit 3G
- 150-02 Northern Blvd Unit 4C
- 150-02 Northern Blvd Unit 6D
- 150-02 Northern Blvd Unit 4K
- 149-34 35th Ave
- 14934 35th Ave
- 3511 149th Place
- 3505 149th Place
- 3513 149th Place
- 3513 149th Place
- 3513 149th Place Unit 1st Fl
- 3515 149th Place
- 35-10 150th St Unit 4M
- 35-10 150th St Unit 4G
- 35-10 150th St Unit L6
- 35-10 150th St Unit 6J
- 35-10 150th St Unit 6H
- 35-10 150th St Unit 5A
- 35-10 150th St Unit 1-V
- 35-10 150th St Unit 4H
- 35-10 150th St Unit 6B
- 35-10 150th St Unit 1G.2Fl
- 35-10 150th St Unit 6V
- 35-10 150th St Unit 6P
Your Personal Tour Guide
Ask me questions while you tour the home.