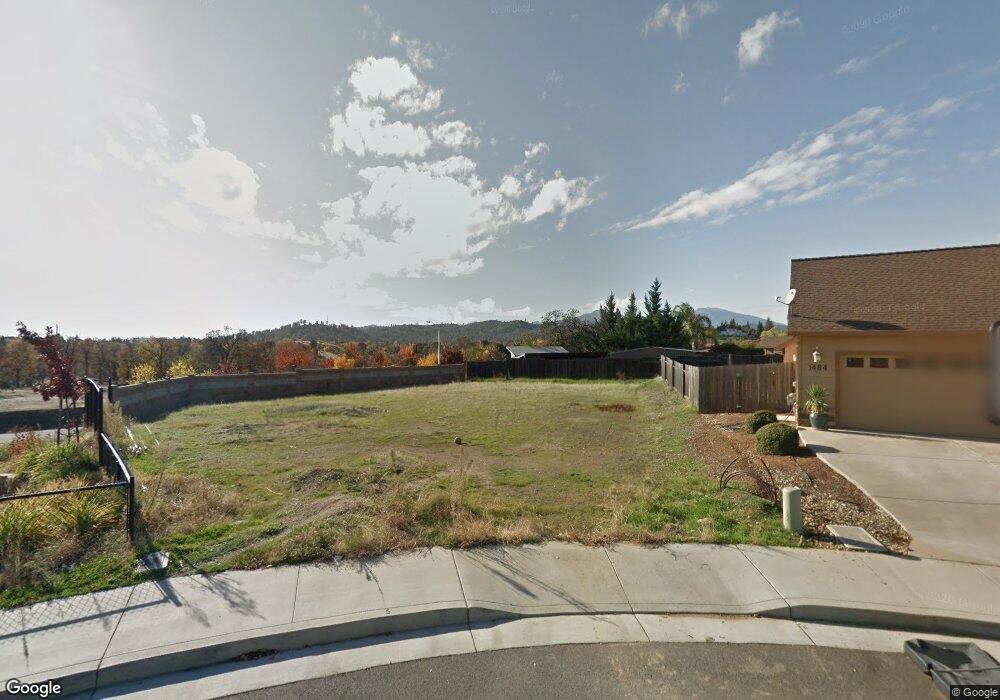
1494 Lear Way Unit Lot 12 Redding, CA 96001
Manzanita NeighborhoodEstimated Value: $453,251 - $584,000
3
Beds
2
Baths
1,602
Sq Ft
$315/Sq Ft
Est. Value
About This Home
This home is located at 1494 Lear Way Unit Lot 12, Redding, CA 96001 and is currently estimated at $505,313, approximately $315 per square foot. 1494 Lear Way Unit Lot 12 is a home located in Shasta County with nearby schools including Manzanita Elementary School, Sequoia Middle School, and Shasta High School.
Ownership History
Date
Name
Owned For
Owner Type
Purchase Details
Closed on
Jan 25, 2019
Sold by
Collier Richard and Collier Terri
Bought by
Collier Richard D and Collier Terri
Current Estimated Value
Home Financials for this Owner
Home Financials are based on the most recent Mortgage that was taken out on this home.
Original Mortgage
$284,000
Outstanding Balance
$250,191
Interest Rate
4.6%
Mortgage Type
New Conventional
Estimated Equity
$255,122
Purchase Details
Closed on
Nov 6, 2012
Sold by
Bergstrom Enterprises Inc
Bought by
Collier Richard and Collier Terri
Home Financials for this Owner
Home Financials are based on the most recent Mortgage that was taken out on this home.
Original Mortgage
$255,500
Interest Rate
3.34%
Mortgage Type
New Conventional
Create a Home Valuation Report for This Property
The Home Valuation Report is an in-depth analysis detailing your home's value as well as a comparison with similar homes in the area
Home Values in the Area
Average Home Value in this Area
Purchase History
| Date | Buyer | Sale Price | Title Company |
|---|---|---|---|
| Collier Richard D | -- | Old Republic Title Co | |
| Collier Richard | $286,000 | Placer Title Company |
Source: Public Records
Mortgage History
| Date | Status | Borrower | Loan Amount |
|---|---|---|---|
| Open | Collier Richard D | $284,000 | |
| Closed | Collier Richard | $255,500 |
Source: Public Records
Tax History Compared to Growth
Tax History
| Year | Tax Paid | Tax Assessment Tax Assessment Total Assessment is a certain percentage of the fair market value that is determined by local assessors to be the total taxable value of land and additions on the property. | Land | Improvement |
|---|---|---|---|---|
| 2025 | $4,059 | $352,178 | $61,567 | $290,611 |
| 2024 | $3,988 | $345,273 | $60,360 | $284,913 |
| 2023 | $3,988 | $338,504 | $59,177 | $279,327 |
| 2022 | $3,916 | $331,867 | $58,017 | $273,850 |
| 2021 | $3,886 | $325,361 | $56,880 | $268,481 |
| 2020 | $3,889 | $322,026 | $56,297 | $265,729 |
| 2019 | $3,683 | $315,713 | $55,194 | $260,519 |
| 2018 | $3,723 | $309,523 | $54,112 | $255,411 |
| 2017 | $3,605 | $303,454 | $53,051 | $250,403 |
| 2016 | $3,533 | $297,505 | $52,011 | $245,494 |
| 2015 | $3,354 | $293,037 | $51,230 | $241,807 |
| 2014 | $3,417 | $287,298 | $50,227 | $237,071 |
Source: Public Records
Map
Nearby Homes
- 3380 Placer St
- 3357 Oakwood Place
- 1355 Bambury Ct
- 3135 Stratford Ave
- 1474 Gladstone Ct
- 1605 Wisconsin Ave
- 4160 Travona Ct
- 1640 Wisconsin Ave
- 3811 Andes Dr
- 4125 Oro St
- 3060 Monte Bello Dr
- 3036 Monte Bello Dr
- 1430 Ridge Dr
- 1756 Mary Lake Dr
- 2760 Shasta St
- 1191 Hillcrest Place
- 1783 Record Ln
- 1575 Fig Ave
- 2166 Wicklow St
- 1310 Olive St
- 1494 Lear Way
- 1484 Lear Way
- 1491 Lear Way Unit Lot 11
- 1491 Lear Way
- 3647 Rosita Dr
- 1474 Lear Way
- 1481 Lear Way
- 3665 Rosita Dr
- 3613 Rosita Dr
- 1471 Lear Way Unit Lot 9
- 1471 Lear Way
- 1471 Lear Way
- 1724 Almaden Dr
- 1464 Lear Way
- 3677 Rosita Dr
- 1726 Almaden Dr
- 1461 Lear Way Unit Lot 8
- 1461 Lear Way
- 0 Rosita Dr
- 1454 Lear Way Unit Lot 16