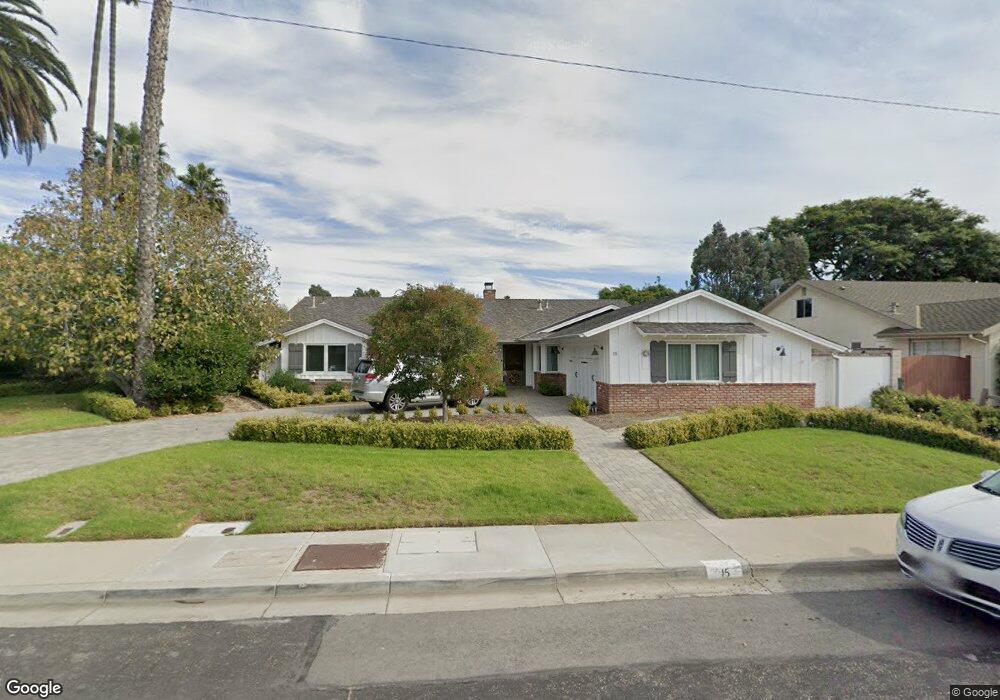
15 Carriage Square Oxnard, CA 93030
Carriage Square NeighborhoodEstimated Value: $1,034,000 - $1,204,000
4
Beds
3
Baths
2,897
Sq Ft
$379/Sq Ft
Est. Value
About This Home
This home is located at 15 Carriage Square, Oxnard, CA 93030 and is currently estimated at $1,097,946, approximately $378 per square foot. 15 Carriage Square is a home located in Ventura County with nearby schools including Sierra Linda Elementary School, Pacifica High School, and Vista Real Charter High School.
Ownership History
Date
Name
Owned For
Owner Type
Purchase Details
Closed on
Jun 25, 2015
Sold by
Partridge John and Partridge Lori
Bought by
John & Lori Partridge Trust and Partridge Lori
Current Estimated Value
Purchase Details
Closed on
Apr 30, 2015
Sold by
Sullenger Arlene
Bought by
Partridge John and Partridge Lori
Purchase Details
Closed on
Nov 6, 2013
Sold by
Sullenger Rudy and Sullenber Arlene M
Bought by
Sullenger Rudy and Sullenger Arlene M
Purchase Details
Closed on
Jul 7, 2001
Sold by
Borchard John W and Chamberlain Edward B
Bought by
Mcgrath Timothy S and Mcgrath Mary Kathleen
Purchase Details
Closed on
Jan 1, 2000
Sold by
Borchard Alma F
Bought by
Borchard Alma F and Chamberlain Edward B
Purchase Details
Closed on
Dec 2, 1999
Sold by
Borchard John W Trust and John W
Bought by
Borchard Alma F
Purchase Details
Closed on
Jun 26, 1997
Sold by
Borchard John W
Bought by
Borchard John W
Create a Home Valuation Report for This Property
The Home Valuation Report is an in-depth analysis detailing your home's value as well as a comparison with similar homes in the area
Home Values in the Area
Average Home Value in this Area
Purchase History
| Date | Buyer | Sale Price | Title Company |
|---|---|---|---|
| John & Lori Partridge Trust | -- | None Available | |
| Partridge John | $515,000 | None Available | |
| Sullenger Rudy | -- | None Available | |
| Mcgrath Timothy S | $412,000 | Chicago Title Co | |
| Borchard Alma F | $32,500 | -- | |
| Borchard Alma F | -- | -- | |
| Borchard Alma F | -- | -- | |
| Borchard John W | -- | -- |
Source: Public Records
Tax History
| Year | Tax Paid | Tax Assessment Tax Assessment Total Assessment is a certain percentage of the fair market value that is determined by local assessors to be the total taxable value of land and additions on the property. | Land | Improvement |
|---|---|---|---|---|
| 2025 | $9,391 | $781,193 | $507,779 | $273,414 |
| 2024 | $9,391 | $765,876 | $497,823 | $268,053 |
| 2023 | $9,047 | $750,859 | $488,061 | $262,798 |
| 2022 | $8,773 | $736,137 | $478,491 | $257,646 |
| 2021 | $8,702 | $721,703 | $469,108 | $252,595 |
| 2020 | $8,863 | $714,305 | $464,299 | $250,006 |
| 2019 | $8,611 | $700,300 | $455,196 | $245,104 |
| 2018 | $8,489 | $686,570 | $446,271 | $240,299 |
| 2017 | $8,054 | $673,109 | $437,521 | $235,588 |
| 2016 | $7,771 | $659,912 | $428,943 | $230,969 |
| 2015 | $6,468 | $535,737 | $294,655 | $241,082 |
| 2014 | $6,396 | $525,244 | $288,884 | $236,360 |
Source: Public Records
Map
Nearby Homes
- 2005 Blackberry Cir
- 2041 Blackberry Cir
- 2016 Blackberry Cir
- 620 W Gonzales Rd
- 620 W Gonzales Rd Unit B
- 620 W Gonzales Rd Unit C
- 620 W Gonzales Rd Unit D
- 620 W Gonzales Rd Unit A
- 2160 Blackberry Cir
- 650 Bluebell Place
- 729 Ivywood Dr
- 411 Eastwood Dr
- 209 Lafayette Dr
- 1010 Janetwood Dr
- 2225 Edelweiss St Unit 43
- 715 W Robert Ave
- 550 Holly Ave
- 255 Douglas Ave
- 722 W Robert Ave
- 800 S A St
- 13 Carriage Square
- 25 Carriage Square
- 27 Carriage Square
- 14 Carriage Square
- 22 Carriage Square
- 16 Carriage Square
- 12 Carriage Square
- 11 Carriage Square
- 29 Carriage Square
- 10 Carriage Square
- 24 Carriage Square
- 28 Carriage Square
- 1734 N C St
- 1816 N C St
- 30 Carriage Square
- 1716 N C St
- 26 Carriage Square
- 9 Carriage Square
- 1834 N C St
- 32 Carriage Square
Your Personal Tour Guide
Ask me questions while you tour the home.