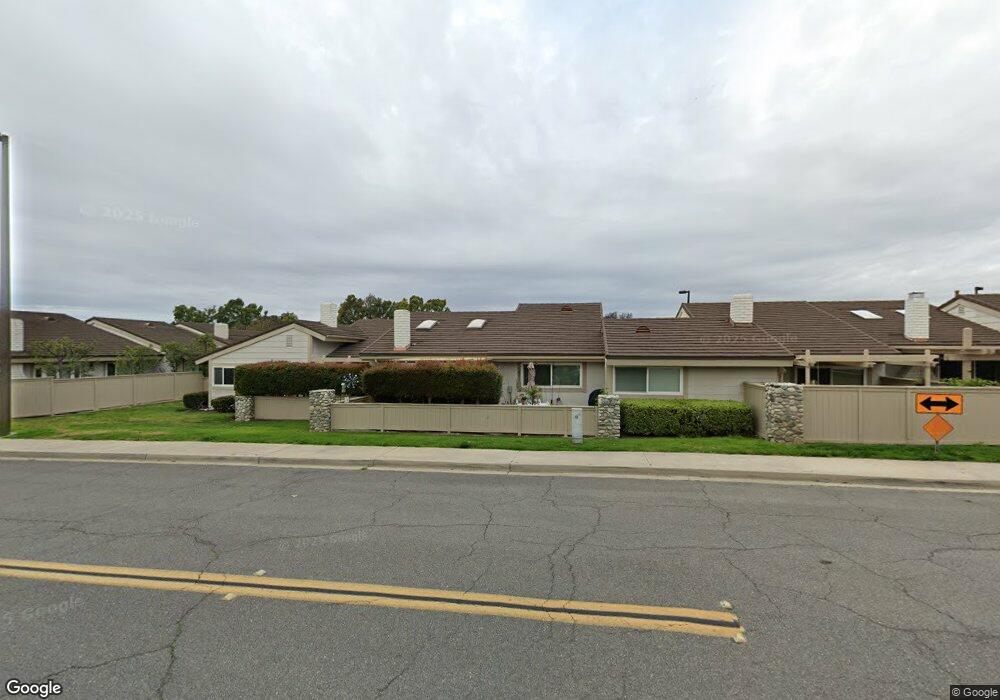
15 Perch Irvine, CA 92604
Woodbridge NeighborhoodEstimated Value: $932,107 - $1,199,000
2
Beds
2
Baths
1,234
Sq Ft
$872/Sq Ft
Est. Value
About This Home
This home is located at 15 Perch, Irvine, CA 92604 and is currently estimated at $1,076,027, approximately $871 per square foot. 15 Perch is a home located in Orange County with nearby schools including Stone Creek Elementary School, Lakeside Middle School, and Woodbridge High School.
Ownership History
Date
Name
Owned For
Owner Type
Purchase Details
Closed on
Jul 2, 2014
Sold by
Lindberg Sheila N
Bought by
Lindberg Sheila N and The Lindberg Trust
Current Estimated Value
Purchase Details
Closed on
Apr 18, 1997
Sold by
Reese Cornelius E
Bought by
Lindberg Sheila N
Home Financials for this Owner
Home Financials are based on the most recent Mortgage that was taken out on this home.
Original Mortgage
$145,600
Outstanding Balance
$17,454
Interest Rate
7.05%
Estimated Equity
$1,058,573
Create a Home Valuation Report for This Property
The Home Valuation Report is an in-depth analysis detailing your home's value as well as a comparison with similar homes in the area
Home Values in the Area
Average Home Value in this Area
Purchase History
| Date | Buyer | Sale Price | Title Company |
|---|---|---|---|
| Lindberg Sheila N | -- | None Available | |
| Lindberg Sheila N | $182,000 | Old Republic Title Company | |
| Reese Cornelius E | -- | Old Republic Title Company |
Source: Public Records
Mortgage History
| Date | Status | Borrower | Loan Amount |
|---|---|---|---|
| Open | Lindberg Sheila N | $145,600 |
Source: Public Records
Tax History
| Year | Tax Paid | Tax Assessment Tax Assessment Total Assessment is a certain percentage of the fair market value that is determined by local assessors to be the total taxable value of land and additions on the property. | Land | Improvement |
|---|---|---|---|---|
| 2025 | $3,156 | $296,413 | $171,677 | $124,736 |
| 2024 | $3,156 | $290,601 | $168,310 | $122,291 |
| 2023 | $3,073 | $284,903 | $165,009 | $119,894 |
| 2022 | $3,001 | $279,317 | $161,773 | $117,544 |
| 2021 | $2,928 | $273,841 | $158,601 | $115,240 |
| 2020 | $2,911 | $271,034 | $156,975 | $114,059 |
| 2019 | $2,846 | $265,720 | $153,897 | $111,823 |
| 2018 | $2,793 | $260,510 | $150,879 | $109,631 |
| 2017 | $2,734 | $255,402 | $147,920 | $107,482 |
| 2016 | $2,616 | $250,395 | $145,020 | $105,375 |
| 2015 | $2,523 | $246,634 | $142,841 | $103,793 |
| 2014 | $2,473 | $241,803 | $140,043 | $101,760 |
Source: Public Records
Map
Nearby Homes
- 16 Driftwood Unit 24
- 8 Sandpiper
- 29 Sandstone
- 16 Woodpine Dr
- 72 Bluejay
- 12 Oakdale
- 26 Morning Dove
- 57 Pinewood Unit 29
- 7 E Yale Loop
- 16 E Yale Loop
- 35 Firwood
- 17 Blazing Star
- 900 Solvay Aisle
- 902 Solvay Aisle Unit 141
- 18 Brookdale
- 1204 Solvay Aisle Unit 230
- 1607 Solvay Aisle Unit 116
- 7 Spring Buck
- 94 Smokestone
- 2605 Ladrillo Aisle Unit 32
- 13 Perch Unit 78
- 13 Perch
- 17 Perch Unit 80
- 17 Perch
- 11 Perch
- 18 Perch
- 24 Wetstone Unit 51
- 24 Wetstone
- 48 Wetstone Unit 39
- 26 Wetstone Unit 50
- 26 Wetstone
- 50 Wetstone Unit 38
- 52 Wetstone Unit 37
- 52 Wetstone
- 16 Perch Unit 82
- 16 Perch
- 22 Wetstone Unit 52
- 46 Wetstone Unit 40
- 9 Perch Unit 72
- 54 Wetstone Unit 36
Your Personal Tour Guide
Ask me questions while you tour the home.