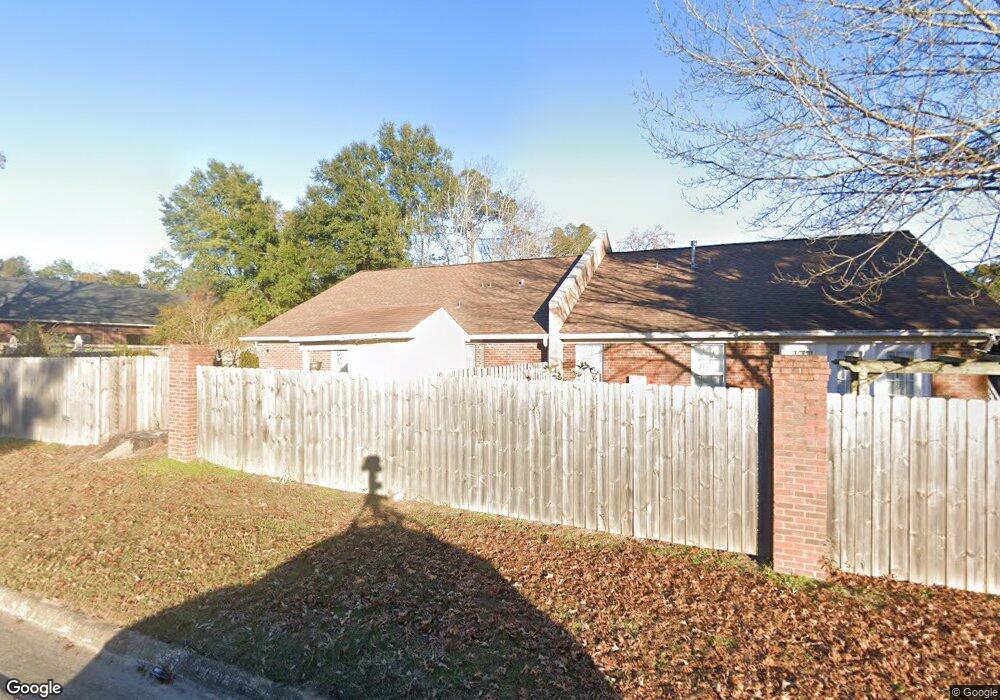
1501 E College St Bainbridge, GA 39819
Estimated Value: $197,000 - $237,226
Studio
1
Bath
1,514
Sq Ft
$148/Sq Ft
Est. Value
About This Home
This home is located at 1501 E College St, Bainbridge, GA 39819 and is currently estimated at $224,307, approximately $148 per square foot. 1501 E College St is a home located in Decatur County with nearby schools including Bainbridge High School and Grace Christian Academy.
Ownership History
Date
Name
Owned For
Owner Type
Purchase Details
Closed on
Jan 11, 2024
Sold by
Peters Zadie B
Bought by
Stewart Jana P and Stewart Timothy E
Current Estimated Value
Purchase Details
Closed on
Dec 19, 2023
Sold by
Porter Lee Ann
Bought by
Peters Zadie B
Purchase Details
Closed on
Jun 1, 2023
Sold by
Peters Zadie B
Bought by
Peters Zadie B and Ann King Porter Lee
Purchase Details
Closed on
Sep 18, 2018
Sold by
Swicord Susan Z
Bought by
Peters Zadie B
Purchase Details
Closed on
Apr 2, 2015
Sold by
Martin Harry D
Bought by
Swicord Susan Z
Purchase Details
Closed on
Jun 23, 2005
Sold by
Massengill Daivd G
Bought by
Martin Harry D
Create a Home Valuation Report for This Property
The Home Valuation Report is an in-depth analysis detailing your home's value as well as a comparison with similar homes in the area
Purchase History
| Date | Buyer | Sale Price | Title Company |
|---|---|---|---|
| Stewart Jana P | $249,900 | -- | |
| Peters Zadie B | -- | -- | |
| Peters Zadie B | -- | -- | |
| Peters Zadie B | $122,500 | -- | |
| Swicord Susan Z | $125,000 | -- | |
| Martin Harry D | $105,000 | -- |
Source: Public Records
Tax History
| Year | Tax Paid | Tax Assessment Tax Assessment Total Assessment is a certain percentage of the fair market value that is determined by local assessors to be the total taxable value of land and additions on the property. | Land | Improvement |
|---|---|---|---|---|
| 2025 | $2,877 | $89,274 | $4,000 | $85,274 |
| 2024 | $1,914 | $60,556 | $4,000 | $56,556 |
| 2023 | $1,366 | $60,556 | $4,000 | $56,556 |
| 2022 | $1,810 | $60,466 | $4,000 | $56,466 |
| 2021 | $1,760 | $57,356 | $8,000 | $49,356 |
| 2020 | $1,856 | $57,238 | $8,000 | $49,238 |
| 2019 | $1,641 | $54,280 | $8,000 | $46,280 |
| 2018 | $1,864 | $54,280 | $8,000 | $46,280 |
| 2017 | $1,737 | $49,673 | $8,000 | $41,673 |
| 2016 | $1,737 | $49,673 | $8,000 | $41,673 |
| 2015 | $1,566 | $49,673 | $8,000 | $41,673 |
| 2014 | $1,444 | $49,673 | $8,000 | $41,673 |
| 2013 | -- | $49,673 | $8,000 | $41,673 |
Source: Public Records
Map
Nearby Homes
- 1511 Woodland Dr
- 1504 Woodland Dr
- 703 S Boulevard Dr
- 1103 Stewart Ave
- 1604 Twin Lakes Dr
- 1600 Dogwood Dr
- 1605 Pineland Dr
- 306 S Boulevard Dr
- 401 S Collier St
- 502 Chason St
- 502 Chason St
- 1715 Douglas Dr
- 809 S Lamar St
- 1203 E Broughton St
- 1204 E Water St
- 600 S Lamar St
- 906 Elizabeth Place
- 1512 Douglas Dr
- 1020 E Water St
- 1702 Culbreth St
- 1501 E College St
- 1501 E College St
- 1501 E College St
- 1501 E College St
- 1501 E College St
- 1501 E College St
- 1501 E College St
- 1501 E College St
- 1501 E College St
- 1501 E College St
- 1501 E College St
- 1503 E College St Unit 10
- 1416 E College St
- 1500 E College St
- 1502 E College St
- 1504 E College St
- 1414 E College St
- 1506 E College St
- 1412 E College St
- 1508 E College St
Your Personal Tour Guide
Ask me questions while you tour the home.