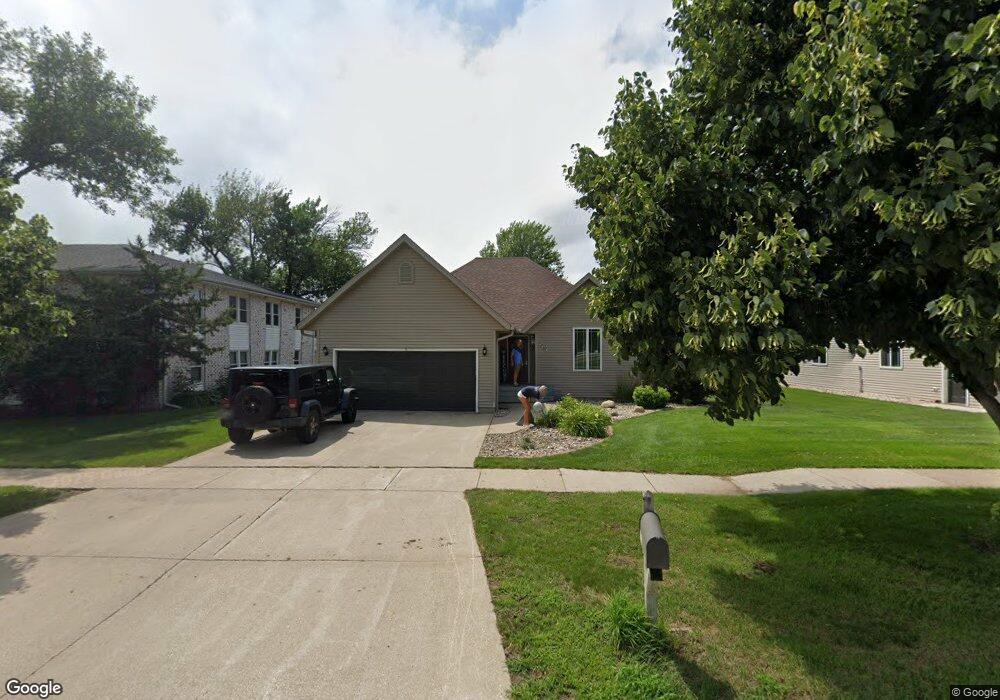
1503 11th Ave W Spencer, IA 51301
Estimated Value: $272,869 - $466,000
3
Beds
2
Baths
1,513
Sq Ft
$225/Sq Ft
Est. Value
About This Home
This home is located at 1503 11th Ave W, Spencer, IA 51301 and is currently estimated at $339,717, approximately $224 per square foot. 1503 11th Ave W is a home located in Clay County with nearby schools including Johnson Elementary School, Fairview Park Elementary School, and Lincoln Elementary School.
Ownership History
Date
Name
Owned For
Owner Type
Purchase Details
Closed on
Jan 17, 2017
Sold by
Kruse Jamie Linn and Kruse Andrea Leigh
Bought by
Kruse Jamie Linn and Jamie Linn Cruse Living Trust
Current Estimated Value
Purchase Details
Closed on
Jul 15, 2016
Sold by
William J Kunert
Bought by
Kruse Jamie
Home Financials for this Owner
Home Financials are based on the most recent Mortgage that was taken out on this home.
Original Mortgage
$20,000
Outstanding Balance
$15,883
Interest Rate
3.42%
Estimated Equity
$323,834
Purchase Details
Closed on
Jul 1, 2016
Sold by
Lisa K Robbins
Bought by
Kruse Jamie
Home Financials for this Owner
Home Financials are based on the most recent Mortgage that was taken out on this home.
Original Mortgage
$20,000
Outstanding Balance
$15,883
Interest Rate
3.42%
Estimated Equity
$323,834
Create a Home Valuation Report for This Property
The Home Valuation Report is an in-depth analysis detailing your home's value as well as a comparison with similar homes in the area
Home Values in the Area
Average Home Value in this Area
Purchase History
| Date | Buyer | Sale Price | Title Company |
|---|---|---|---|
| Kruse Jamie Linn | -- | None Available | |
| Kruse Jamie | -- | -- | |
| Kruse Jamie | -- | -- |
Source: Public Records
Mortgage History
| Date | Status | Borrower | Loan Amount |
|---|---|---|---|
| Open | Kruse Jamie | $20,000 | |
| Closed | Kruse Jamie | -- | |
| Open | Kruse Jamie | $160,650 | |
| Closed | Kruse Jamie | -- |
Source: Public Records
Tax History Compared to Growth
Tax History
| Year | Tax Paid | Tax Assessment Tax Assessment Total Assessment is a certain percentage of the fair market value that is determined by local assessors to be the total taxable value of land and additions on the property. | Land | Improvement |
|---|---|---|---|---|
| 2025 | $3,986 | $269,260 | $27,870 | $241,390 |
| 2024 | $3,986 | $248,930 | $22,300 | $226,630 |
| 2023 | $3,850 | $248,930 | $22,300 | $226,630 |
| 2022 | $3,648 | $217,150 | $22,300 | $194,850 |
| 2021 | $3,720 | $204,140 | $22,300 | $181,840 |
| 2020 | $3,720 | $197,470 | $20,900 | $176,570 |
| 2019 | $3,378 | $184,110 | $0 | $0 |
| 2018 | $3,326 | $184,110 | $0 | $0 |
| 2017 | $3,326 | $176,140 | $0 | $0 |
| 2016 | $3,140 | $176,140 | $0 | $0 |
| 2015 | $2,924 | $164,650 | $0 | $0 |
| 2014 | $2,834 | $164,650 | $0 | $0 |
Source: Public Records
Map
Nearby Homes
- 1613 11th Ave W Unit 2
- 1512 17th Ave W
- 1423 18th Ave W
- 1305 18th Ave W
- 1312 4th Ave W
- 821 Fisher Ct
- 817 Fisher Ct
- 2201 18th Ave W
- 1203 W 5th St
- 1322 Country Club Dr
- 1905 20th Ave W
- 2002 20th Ave W
- 1901 20th Ave W
- 543 7th Ave W
- 807 4th Ave W
- 2003 20th Ave W
- 422 11th Ave W
- 2008 W 20th St
- 900 W 5th St
- 2108 20th Ave W
- 1110 Mcnaughton Way
- 1112 Mcnaughton Way
- 1506 12th Ave W Unit 6
- 1506 12th Ave W Unit 5
- 1506 12th Ave W Unit 4
- 1506 12th Ave W Unit 3
- 1506 12th Ave W Unit 2
- 1506 12th Ave W Unit 1
- 1113 Mcnaughton Way Unit 1
- 1405 11th Ave W
- 1107 W 14th St
- 1403 11th Ave W
- 1115 Mcnaughton Way Unit 2
- 1117 Mcnaughton Way Unit 3
- 1203 W 14th St
- 1601 11th Ave W Unit 3
- 1406 Marks Ct
- 1410 Marks Ct
- 1402 Marks Ct
- 1201 Mcnaughton Way Unit 1