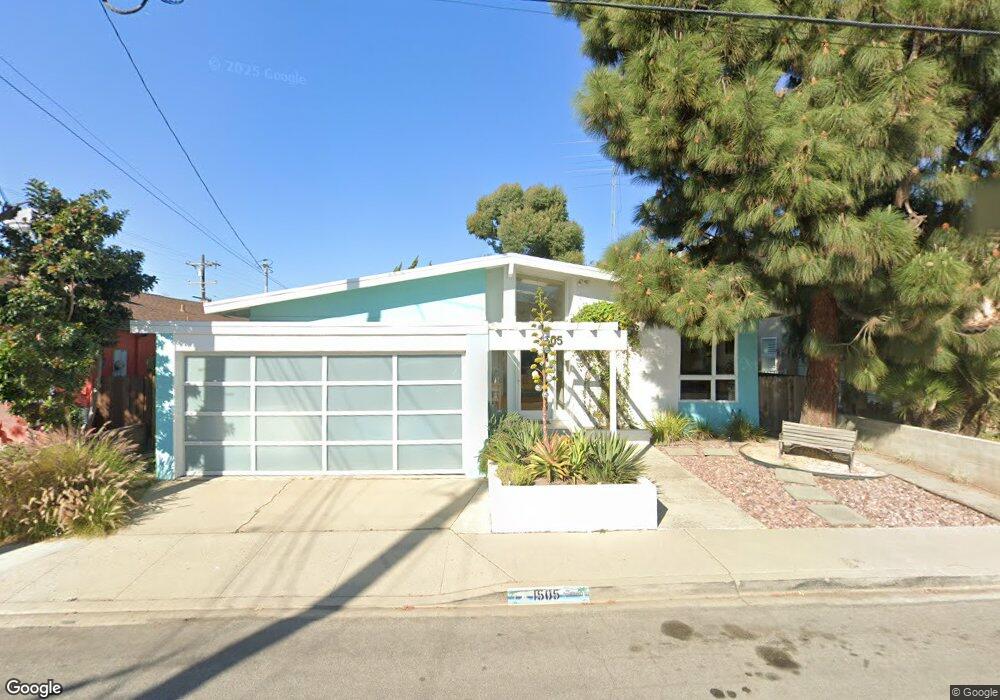
1505 5th St Manhattan Beach, CA 90266
Estimated Value: $2,363,414 - $3,673,000
4
Beds
3
Baths
1,823
Sq Ft
$1,687/Sq Ft
Est. Value
About This Home
This home is located at 1505 5th St, Manhattan Beach, CA 90266 and is currently estimated at $3,074,854, approximately $1,686 per square foot. 1505 5th St is a home located in Los Angeles County with nearby schools including Aurelia Pennekamp Elementary School, Manhattan Beach Middle School, and Mira Costa High School.
Ownership History
Date
Name
Owned For
Owner Type
Purchase Details
Closed on
Apr 21, 2017
Sold by
Nunan William J and Ahlers Eve D
Bought by
Nunan William J and Ahlers Eve D
Current Estimated Value
Purchase Details
Closed on
May 14, 1996
Sold by
Finnila Charles A and Finnila Mona C
Bought by
Nunan William and Ahlers Eve
Home Financials for this Owner
Home Financials are based on the most recent Mortgage that was taken out on this home.
Original Mortgage
$207,000
Outstanding Balance
$11,752
Interest Rate
7.96%
Estimated Equity
$3,063,102
Create a Home Valuation Report for This Property
The Home Valuation Report is an in-depth analysis detailing your home's value as well as a comparison with similar homes in the area
Home Values in the Area
Average Home Value in this Area
Purchase History
| Date | Buyer | Sale Price | Title Company |
|---|---|---|---|
| Nunan William J | -- | None Available | |
| Ahlers Eve D | -- | None Available | |
| Nunan William | $408,500 | Chicago Title Insurance Co |
Source: Public Records
Mortgage History
| Date | Status | Borrower | Loan Amount |
|---|---|---|---|
| Open | Nunan William | $207,000 |
Source: Public Records
Tax History
| Year | Tax Paid | Tax Assessment Tax Assessment Total Assessment is a certain percentage of the fair market value that is determined by local assessors to be the total taxable value of land and additions on the property. | Land | Improvement |
|---|---|---|---|---|
| 2025 | $8,097 | $678,605 | $542,892 | $135,713 |
| 2024 | $8,097 | $665,300 | $532,248 | $133,052 |
| 2023 | $7,785 | $652,256 | $521,812 | $130,444 |
| 2022 | $7,657 | $639,468 | $511,581 | $127,887 |
| 2021 | $7,568 | $626,930 | $501,550 | $125,380 |
| 2019 | $7,372 | $608,337 | $486,675 | $121,662 |
| 2018 | $7,166 | $596,410 | $477,133 | $119,277 |
| 2016 | $6,512 | $573,253 | $458,606 | $114,647 |
| 2015 | $6,379 | $564,643 | $451,718 | $112,925 |
| 2014 | $6,300 | $553,583 | $442,870 | $110,713 |
Source: Public Records
Map
Nearby Homes
- 1450 6th St
- 1500 2nd St
- 1643 3rd St
- 1659 3rd St
- 1623 8th St
- 1612 Gates Ave
- 912 N Rowell Ave
- 1806 6th St
- 1450 Manhattan Beach Blvd
- 308 S Redondo Ave
- 1416 Manhattan Beach Blvd
- 1769 Gates Ave
- 1652 Voorhees Ave
- 1816 9th St
- 1820 9th St
- 1647 Ruhland Ave
- 1726 Voorhees Ave
- 1852 6th St
- 311 Aviation Place
- 1827 9th St
Your Personal Tour Guide
Ask me questions while you tour the home.