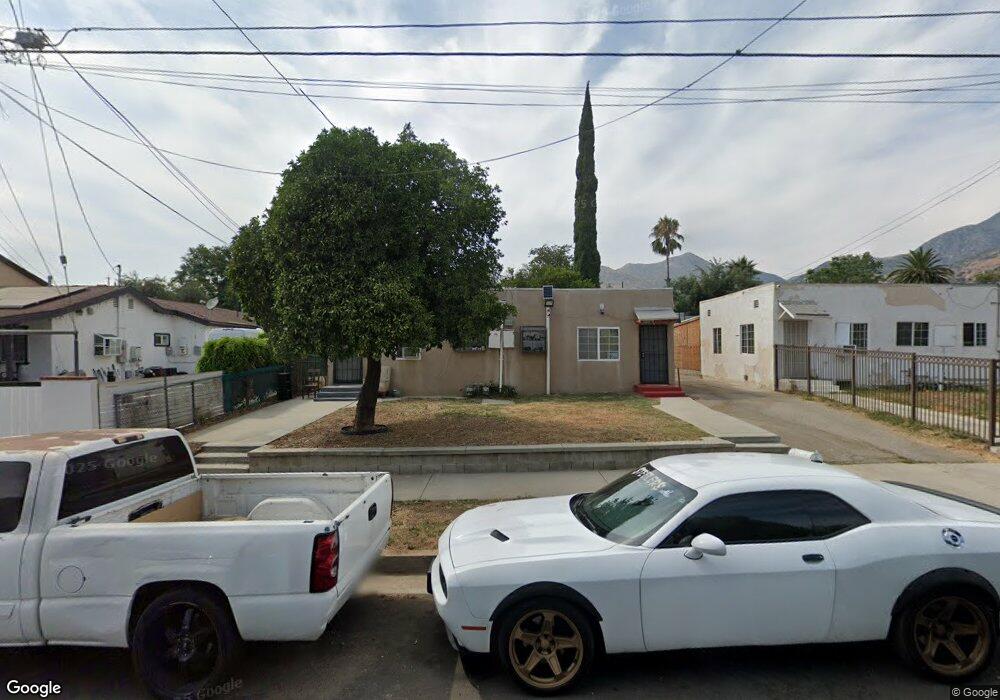
15081 La Mesa St Sylmar, CA 91342
Estimated Value: $566,000 - $674,569
2
Beds
2
Baths
880
Sq Ft
$722/Sq Ft
Est. Value
About This Home
This home is located at 15081 La Mesa St, Sylmar, CA 91342 and is currently estimated at $635,642, approximately $722 per square foot. 15081 La Mesa St is a home located in Los Angeles County with nearby schools including Herrick Avenue Elementary School, Olive Vista Middle School, and San Fernando Senior High School.
Ownership History
Date
Name
Owned For
Owner Type
Purchase Details
Closed on
Jul 9, 2013
Sold by
Vargas Baudelio H
Bought by
Safe Haven Living Llc
Current Estimated Value
Purchase Details
Closed on
Feb 29, 2004
Sold by
Vargas Elvia H
Bought by
Vargas Elvia H and The Elvia H Vargas Living Trust
Purchase Details
Closed on
Jan 26, 2000
Sold by
Chiapa Raul and Garcia Dorothy P
Bought by
Vargas Baudelio Hernandez
Purchase Details
Closed on
Sep 13, 1999
Sold by
Garcia Edward M
Bought by
Garcia Dorothy P
Purchase Details
Closed on
Aug 28, 1999
Sold by
Hud
Bought by
Chiapa Raul
Purchase Details
Closed on
Aug 13, 1998
Sold by
Norwest Mtg Inc
Bought by
Hud
Purchase Details
Closed on
Feb 5, 1998
Sold by
Obrero George A and Norwest Mtg Inc
Bought by
Norwest Mtg Inc
Purchase Details
Closed on
May 15, 1995
Sold by
Tamayo George
Bought by
Tamayo Tony
Create a Home Valuation Report for This Property
The Home Valuation Report is an in-depth analysis detailing your home's value as well as a comparison with similar homes in the area
Home Values in the Area
Average Home Value in this Area
Purchase History
| Date | Buyer | Sale Price | Title Company |
|---|---|---|---|
| Safe Haven Living Llc | -- | None Available | |
| Vargas Elvia H | -- | -- | |
| Vargas Baudelio Hernandez | $113,000 | First American Title Co | |
| Garcia Dorothy P | -- | Provident Title | |
| Chiapa Raul | -- | Provident Title | |
| Chiapa Raul | $75,000 | Provident Title | |
| Hud | -- | Northern Counties Title Ins | |
| Norwest Mtg Inc | $148,212 | Northern Counties Title Co | |
| Tamayo Tony | -- | -- |
Source: Public Records
Tax History Compared to Growth
Tax History
| Year | Tax Paid | Tax Assessment Tax Assessment Total Assessment is a certain percentage of the fair market value that is determined by local assessors to be the total taxable value of land and additions on the property. | Land | Improvement |
|---|---|---|---|---|
| 2025 | $2,347 | $173,652 | $99,892 | $73,760 |
| 2024 | $2,347 | $170,248 | $97,934 | $72,314 |
| 2023 | $2,306 | $166,911 | $96,014 | $70,897 |
| 2022 | $2,207 | $163,639 | $94,132 | $69,507 |
| 2021 | $2,178 | $160,432 | $92,287 | $68,145 |
| 2019 | $2,118 | $155,675 | $89,550 | $66,125 |
| 2018 | $2,029 | $152,624 | $87,795 | $64,829 |
| 2016 | $1,935 | $146,699 | $84,387 | $62,312 |
| 2015 | $1,909 | $144,497 | $83,120 | $61,377 |
| 2014 | $1,929 | $141,667 | $81,492 | $60,175 |
Source: Public Records
Map
Nearby Homes
- 15122 Roxford St Unit 7
- 13522 Glenoaks Blvd Unit 4
- 13531 Fusano Ave
- 14833 Ararat St
- 15245 Monte St
- 14890 Foothill Blvd
- 15232 Foothill Blvd Unit 111
- 13656 Dronfield Ave
- 15185 Cobalt St
- 13800 Glenoaks Blvd
- 13775 Glenoaks Blvd Unit 16
- 13717 Deane Ln
- 15455 Glenoaks Blvd Unit 46
- 15455 Glenoaks Blvd Unit 507
- 15455 Glenoaks Blvd Unit 226
- 15455 Glenoaks Blvd Unit 502
- 15455 Glenoaks Blvd Unit 146
- 15455 Glenoaks Blvd Unit 557
- 15455 Glenoaks Blvd Unit 299
- 13346 Los Olivos Rd
- 15087 La Mesa St
- 15073 La Mesa St Unit A & B
- 15073 La Mesa St
- 15089 La Mesa St
- 15069 La Mesa St
- 13614 Fellows Ave
- 15063 La Mesa St
- 15086 Roxford St
- 15090 Roxford St
- 15080 Roxford St
- 15096 Roxford St
- 15076 Roxford St
- 15059 La Mesa St
- 15080 La Mesa St
- 15090 La Mesa St
- 15074 La Mesa St
- 15084 La Mesa St
- 15072 Roxford St
- 15070 La Mesa St
- 15064 La Mesa St