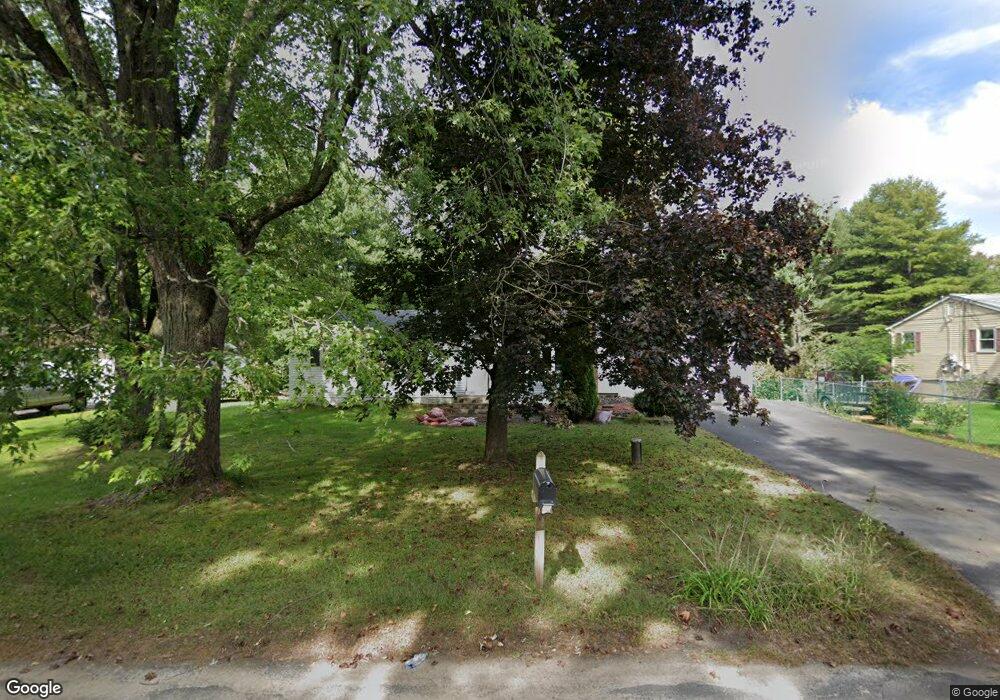
151 Conklin Rd Stafford Springs, CT 06076
Stafford NeighborhoodEstimated Value: $311,000 - $357,000
3
Beds
2
Baths
1,050
Sq Ft
$323/Sq Ft
Est. Value
About This Home
This home is located at 151 Conklin Rd, Stafford Springs, CT 06076 and is currently estimated at $338,744, approximately $322 per square foot. 151 Conklin Rd is a home located in Tolland County with nearby schools including Stafford Elementary School, Stafford Middle School, and Stafford High School.
Ownership History
Date
Name
Owned For
Owner Type
Purchase Details
Closed on
Oct 30, 2024
Sold by
Roy Joseph R
Bought by
Roy Theresa A
Current Estimated Value
Purchase Details
Closed on
Jun 15, 2007
Sold by
Mccabe Colin and Mccabe Tina
Bought by
Roy Theresa and Roy Joseph
Home Financials for this Owner
Home Financials are based on the most recent Mortgage that was taken out on this home.
Original Mortgage
$164,000
Interest Rate
6.19%
Purchase Details
Closed on
Dec 18, 2002
Sold by
Fish Richard and Fish Donna
Bought by
Aysan Tina and Mccabe Colin
Home Financials for this Owner
Home Financials are based on the most recent Mortgage that was taken out on this home.
Original Mortgage
$145,221
Interest Rate
6.16%
Purchase Details
Closed on
Jun 30, 1987
Sold by
Fay Susan
Bought by
Cantor Gloria
Create a Home Valuation Report for This Property
The Home Valuation Report is an in-depth analysis detailing your home's value as well as a comparison with similar homes in the area
Home Values in the Area
Average Home Value in this Area
Purchase History
| Date | Buyer | Sale Price | Title Company |
|---|---|---|---|
| Roy Theresa A | -- | None Available | |
| Roy Theresa A | -- | None Available | |
| Roy Theresa | $217,000 | -- | |
| Aysan Tina | $147,500 | -- | |
| Roy Theresa | $217,000 | -- | |
| Aysan Tina | $147,500 | -- | |
| Cantor Gloria | $119,900 | -- |
Source: Public Records
Mortgage History
| Date | Status | Borrower | Loan Amount |
|---|---|---|---|
| Previous Owner | Cantor Gloria | $164,000 | |
| Previous Owner | Cantor Gloria | $145,221 |
Source: Public Records
Tax History Compared to Growth
Tax History
| Year | Tax Paid | Tax Assessment Tax Assessment Total Assessment is a certain percentage of the fair market value that is determined by local assessors to be the total taxable value of land and additions on the property. | Land | Improvement |
|---|---|---|---|---|
| 2025 | $7,091 | $123,620 | $30,450 | $93,170 |
| 2024 | $4,770 | $123,620 | $30,450 | $93,170 |
| 2023 | $4,544 | $123,620 | $30,450 | $93,170 |
| 2022 | $4,423 | $123,620 | $30,450 | $93,170 |
| 2021 | $4,318 | $123,620 | $30,450 | $93,170 |
| 2020 | $4,308 | $123,340 | $35,630 | $87,710 |
| 2019 | $4,333 | $124,040 | $35,630 | $88,410 |
| 2018 | $4,250 | $124,040 | $35,630 | $88,410 |
| 2017 | $4,209 | $124,040 | $35,630 | $88,410 |
| 2016 | $4,157 | $124,040 | $35,630 | $88,410 |
| 2015 | $3,956 | $124,600 | $35,630 | $88,970 |
| 2014 | $4,116 | $124,600 | $35,630 | $88,970 |
Source: Public Records
Map
Nearby Homes
- 115 Conklin Rd
- 20 Old Birch Rd
- 267 Sandy Beach Rd
- 26 Green St
- 127 Sandy Beach Rd
- 12 Burbank Rd
- 7 Gulf Rd
- 12 Petersson Cir
- 42 Ladd Rd
- 100 Wildwood Rd
- 8 Thomas Dr
- 188B W Stafford Rd
- 15 Usher Ridge
- 68 Usher Ridge
- 36 Usher Ridge
- 0 Tolland Turnpike
- 110 Neff Hill Rd
- 130 Neff Hill Rd
- 105 Neff Hill Rd
- 137 Neff Hill Rd