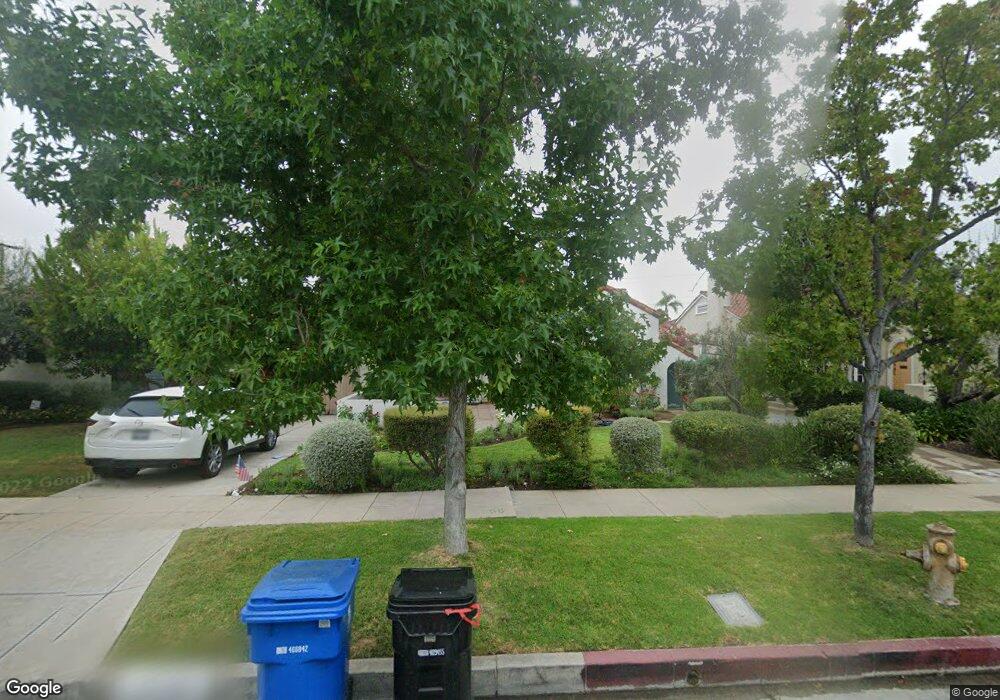
151 N Plymouth Blvd Los Angeles, CA 90004
Windsor Square NeighborhoodEstimated Value: $2,214,581 - $2,563,000
3
Beds
2
Baths
1,825
Sq Ft
$1,336/Sq Ft
Est. Value
About This Home
This home is located at 151 N Plymouth Blvd, Los Angeles, CA 90004 and is currently estimated at $2,437,395, approximately $1,335 per square foot. 151 N Plymouth Blvd is a home located in Los Angeles County with nearby schools including Van Ness Avenue Elementary School, John Burroughs Middle School, and Fairfax High School.
Ownership History
Date
Name
Owned For
Owner Type
Purchase Details
Closed on
Jun 12, 2008
Sold by
Kirk Brandon
Bought by
Jones Allison
Current Estimated Value
Home Financials for this Owner
Home Financials are based on the most recent Mortgage that was taken out on this home.
Original Mortgage
$729,750
Outstanding Balance
$468,756
Interest Rate
6.07%
Mortgage Type
Purchase Money Mortgage
Estimated Equity
$1,968,639
Purchase Details
Closed on
Apr 6, 2004
Sold by
Asper Bruce
Bought by
Kirk Brandon and Kirk Wendy
Home Financials for this Owner
Home Financials are based on the most recent Mortgage that was taken out on this home.
Original Mortgage
$700,000
Interest Rate
5.12%
Mortgage Type
Purchase Money Mortgage
Purchase Details
Closed on
Nov 25, 1997
Sold by
Herman Gary J
Bought by
Asper Bruce and Asper Shannon
Home Financials for this Owner
Home Financials are based on the most recent Mortgage that was taken out on this home.
Original Mortgage
$382,500
Interest Rate
7.25%
Create a Home Valuation Report for This Property
The Home Valuation Report is an in-depth analysis detailing your home's value as well as a comparison with similar homes in the area
Home Values in the Area
Average Home Value in this Area
Purchase History
| Date | Buyer | Sale Price | Title Company |
|---|---|---|---|
| Jones Allison | $1,364,000 | Equity Title Los Angeles | |
| Kirk Brandon | $1,000,000 | Equity Title Company | |
| Asper Bruce | -- | Commonwealth Land Title Co |
Source: Public Records
Mortgage History
| Date | Status | Borrower | Loan Amount |
|---|---|---|---|
| Open | Jones Allison | $729,750 | |
| Previous Owner | Kirk Brandon | $700,000 | |
| Previous Owner | Asper Bruce | $382,500 |
Source: Public Records
Tax History Compared to Growth
Tax History
| Year | Tax Paid | Tax Assessment Tax Assessment Total Assessment is a certain percentage of the fair market value that is determined by local assessors to be the total taxable value of land and additions on the property. | Land | Improvement |
|---|---|---|---|---|
| 2025 | $21,018 | $1,756,496 | $1,287,758 | $468,738 |
| 2024 | $21,018 | $1,722,056 | $1,262,508 | $459,548 |
| 2023 | $20,612 | $1,688,291 | $1,237,753 | $450,538 |
| 2022 | $19,653 | $1,655,188 | $1,213,484 | $441,704 |
| 2021 | $19,415 | $1,622,735 | $1,189,691 | $433,044 |
| 2019 | $18,832 | $1,574,605 | $1,154,405 | $420,200 |
| 2018 | $18,733 | $1,543,731 | $1,131,770 | $411,961 |
| 2016 | $17,927 | $1,483,788 | $1,087,823 | $395,965 |
| 2015 | $16,930 | $1,400,000 | $1,027,000 | $373,000 |
| 2014 | $15,148 | $1,222,000 | $896,000 | $326,000 |
Source: Public Records
Map
Nearby Homes
- 253 N Irving Blvd
- 326 N Gower St
- 226 N Irving Blvd
- 408 N Beachwood Dr
- 312 N Bronson Ave
- 200 Lorraine Blvd
- 100 N Arden Blvd
- 362 N Norton Ave
- 111 S Van Ness Ave
- 218 Lorraine Blvd
- 424 N Arden Blvd
- 5010 Elmwood Ave
- 516 N Bronson Ave
- 5021 Elmwood Ave
- 507 N Lucerne Blvd
- 441 N Norton Ave
- 234 N Ridgewood Place
- 250 N Ridgewood Place
- 236 S Irving Blvd
- 584 N Plymouth Blvd
- 203 N Plymouth Blvd
- 143 N Plymouth Blvd
- 209 N Plymouth Blvd
- 202 N Beachwood Dr
- 208 N Beachwood Dr
- 136 N Beachwood Dr
- 212 N Beachwood Dr
- 215 N Plymouth Blvd
- 129 N Plymouth Blvd
- 130 N Beachwood Dr
- 200 N Plymouth Blvd
- 140 N Plymouth Blvd
- 216 N Beachwood Dr
- 202 N Plymouth Blvd
- 134 N Plymouth Blvd
- 120 N Beachwood Dr
- 221 N Plymouth Blvd
- 123 N Plymouth Blvd
- 212 N Plymouth Blvd
- 128 N Plymouth Blvd