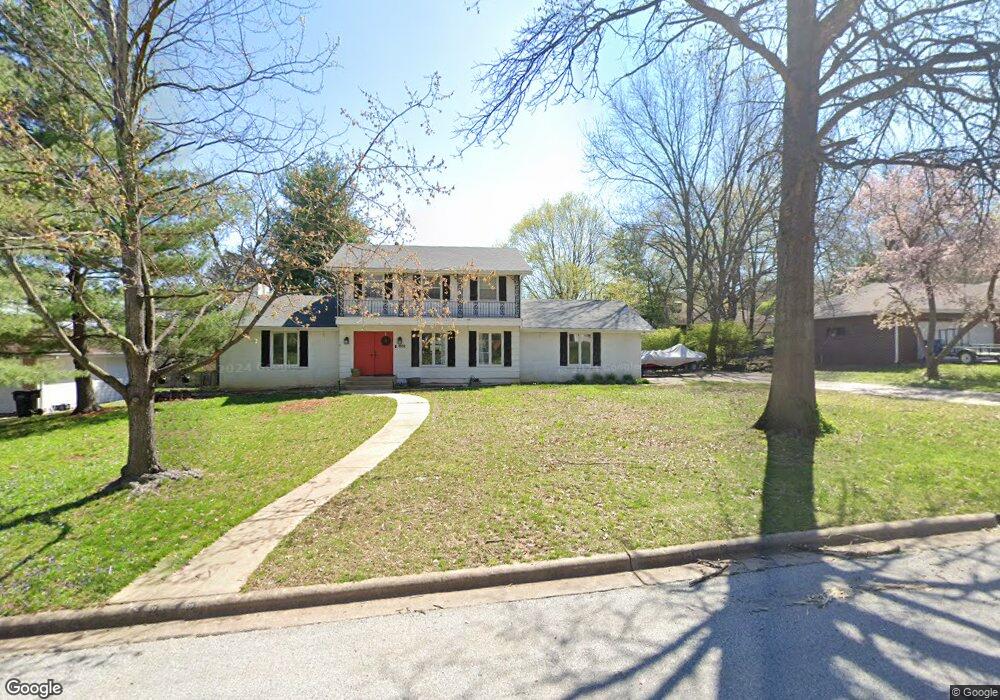
1512 S Charing Ave Springfield, MO 65809
Southeast Springfield NeighborhoodEstimated Value: $331,000 - $388,000
4
Beds
3
Baths
3,408
Sq Ft
$106/Sq Ft
Est. Value
About This Home
This home is located at 1512 S Charing Ave, Springfield, MO 65809 and is currently estimated at $359,922, approximately $105 per square foot. 1512 S Charing Ave is a home located in Greene County with nearby schools including Wilder Elementary School, Glendale High School, and Grace Classical Academy.
Ownership History
Date
Name
Owned For
Owner Type
Purchase Details
Closed on
Feb 26, 2010
Sold by
Prudential Relocation Inc
Bought by
Hacker John and Hacker Kiley
Current Estimated Value
Purchase Details
Closed on
Nov 12, 2009
Sold by
Mcgurie Joseph T and Mcguire Mayuko T
Bought by
Prudential Relocation Inc
Purchase Details
Closed on
Apr 28, 2006
Sold by
Meek Gary and Meek Tara
Bought by
Mcguire Joseph T and Mcguire Mayuko T
Home Financials for this Owner
Home Financials are based on the most recent Mortgage that was taken out on this home.
Original Mortgage
$168,000
Interest Rate
6.32%
Mortgage Type
New Conventional
Purchase Details
Closed on
Sep 8, 2005
Sold by
Hanner Christopher D
Bought by
Meek Gary and Meek Tara
Home Financials for this Owner
Home Financials are based on the most recent Mortgage that was taken out on this home.
Original Mortgage
$172,000
Interest Rate
5.78%
Mortgage Type
Construction
Create a Home Valuation Report for This Property
The Home Valuation Report is an in-depth analysis detailing your home's value as well as a comparison with similar homes in the area
Home Values in the Area
Average Home Value in this Area
Purchase History
| Date | Buyer | Sale Price | Title Company |
|---|---|---|---|
| Hacker John | -- | None Available | |
| Prudential Relocation Inc | -- | None Available | |
| Mcguire Joseph T | -- | None Available | |
| Meek Gary | -- | Fidelity Title Agency |
Source: Public Records
Mortgage History
| Date | Status | Borrower | Loan Amount |
|---|---|---|---|
| Previous Owner | Mcguire Joseph T | $168,000 | |
| Previous Owner | Meek Gary | $172,000 |
Source: Public Records
Tax History
| Year | Tax Paid | Tax Assessment Tax Assessment Total Assessment is a certain percentage of the fair market value that is determined by local assessors to be the total taxable value of land and additions on the property. | Land | Improvement |
|---|---|---|---|---|
| 2025 | $2,489 | $49,950 | $7,600 | $42,350 |
| 2024 | $2,422 | $45,140 | $4,750 | $40,390 |
| 2023 | $2,408 | $45,140 | $4,750 | $40,390 |
| 2022 | $2,105 | $38,550 | $4,750 | $33,800 |
| 2021 | $2,105 | $38,550 | $4,750 | $33,800 |
| 2020 | $2,042 | $35,760 | $4,750 | $31,010 |
| 2019 | $1,985 | $35,760 | $4,750 | $31,010 |
| 2018 | $1,688 | $30,420 | $3,800 | $26,620 |
| 2017 | $1,670 | $29,390 | $3,800 | $25,590 |
| 2016 | $1,611 | $29,390 | $3,800 | $25,590 |
| 2015 | $1,596 | $29,390 | $3,800 | $25,590 |
| 2014 | $1,546 | $28,270 | $3,800 | $24,470 |
Source: Public Records
Map
Nearby Homes
- 1516 S Essex Rd
- 3803 E Linwood St
- 3534 E Whitehall Dr
- 3834 E Stanford St
- 3438 E Carol Dr
- 1315 S Oak Run Place
- 3546 E Cinnamon Place
- 3526 E Cinnamon Place
- 1455 S Oakmont Ave
- 3460 E Catalpa St
- 4058 E Linwood St
- 1318 S Jones Mill Ln
- 4129 E Linwood St
- 1634 S Saint Charles Ave
- 4103 E Crighton Place
- 1650 S Saint Charles Ave
- 4094 E Washita St
- 4164 E Oak Knoll St
- 1957 S Oakmont Ave
- 1456 S Bright Oak Ave
- 1512 S Charing Rd
- 1502 S Charing Rd
- 1515 S Devon Rd
- 1524 S Charing Rd
- 1505 S Devon Rd
- 1519 S Devon Rd
- 1500 S Charing Ave
- 1500 S Charing Rd
- 1515 S Charing Rd
- 1525 S Charing Ave
- 1525 S Charing Rd
- 1534 S Charing Rd
- 1529 S Charing Ave
- 1534 S Charing Ave
- 1501 S Charing Rd
- 1453 S Devon Rd
- 1525 S Devon Rd
- 1527 S Charing Rd
- 1516 S Devon Rd
- 1504 S Devon Rd
Your Personal Tour Guide
Ask me questions while you tour the home.