
Seller's Agent in 2025
Kristin Glassburn
@properties
(317) 513-4251
1 in this area
218 Total Sales
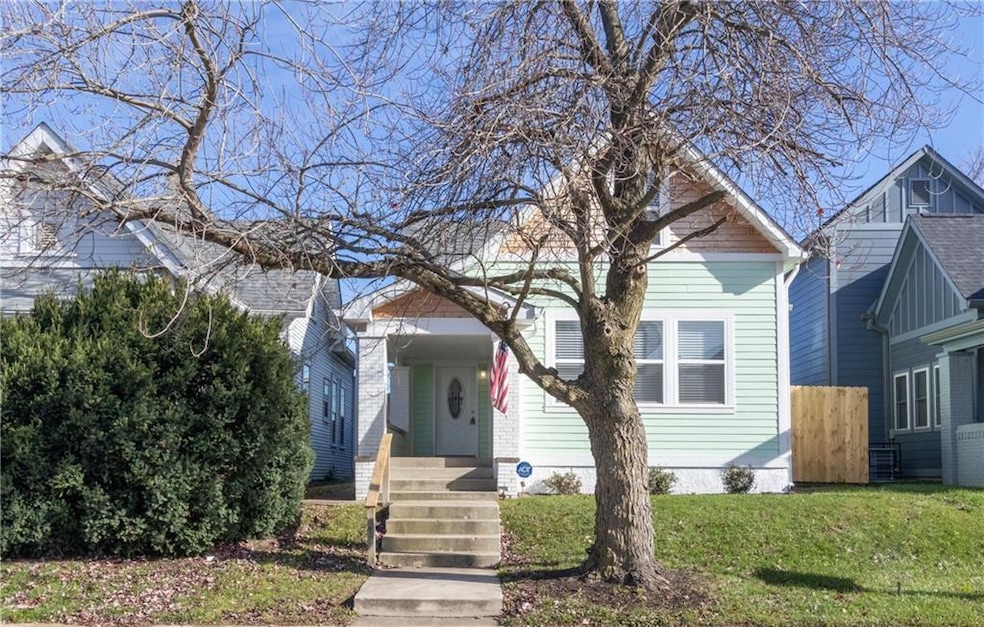
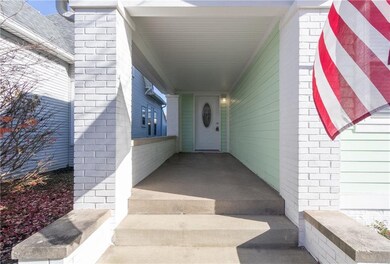
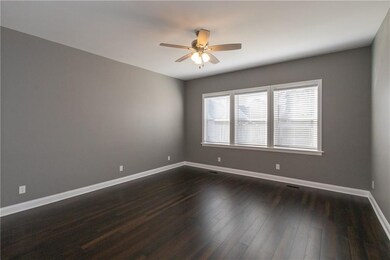
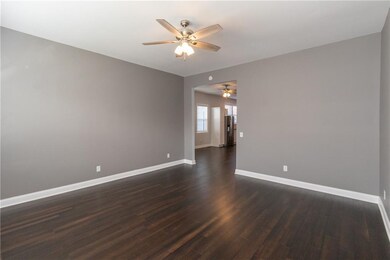
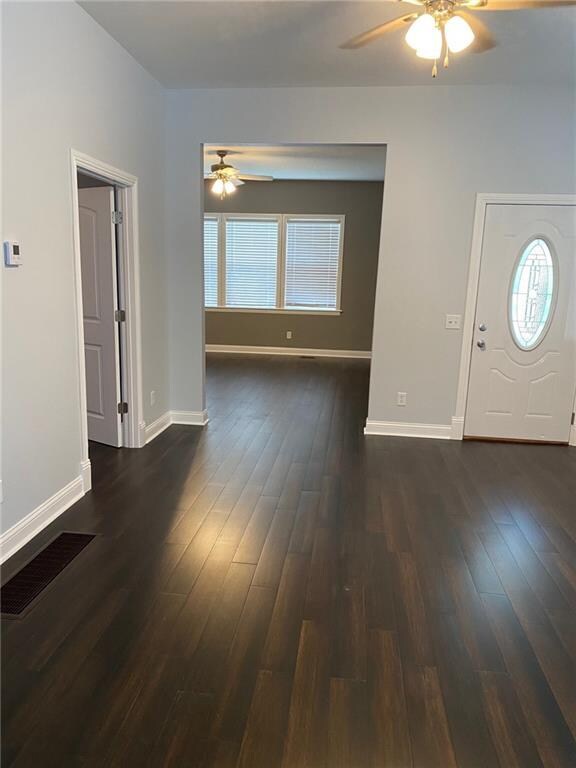

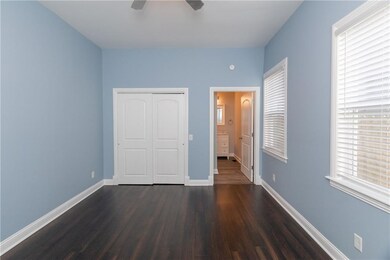
totally rehabbed down to studs, 4 BR, 2 1/2 bath home in the revitalized Old Southside Neighborhood. New Roof, new windows, new HVAC, new electric, new Hardie board siding, new appliances, laminate floors, ceramic floors and carpet. Granite kitchen and bath counter tops, open floor plan downstairs, dry basement, upgraded bath and kitchen finishes, walk-in pantry, laundry room, good sized bedrooms upstairs, MBR suite downstairs, 4th Bedroom could also be a bonus room, privacy fence.
Last Agent to Sell the Property
Joe Sullivan
Sullivan Realty Group, LLC Listed on: 08/04/2021
Last Buyer's Agent
Kristin Glassburn
@properties
| Date | Type | Sale Price | Title Company |
|---|---|---|---|
| Warranty Deed | -- | Green Kassandra | |
| Warranty Deed | $295,000 | Green Kassandra | |
| Warranty Deed | $53,000 | Best Title Services | |
| Deed | $30,000 | -- | |
| Deed | $30,000 | Security Title Services | |
| Deed | $23,000 | -- | |
| Warranty Deed | -- | Best Title |
| Date | Status | Loan Amount | Loan Type |
|---|---|---|---|
| Open | $286,150 | New Conventional | |
| Closed | $286,150 | New Conventional |
| Date | Event | Price | Change | Sq Ft Price |
|---|---|---|---|---|
| 09/11/2025 09/11/25 | Pending | -- | -- | -- |
| 09/03/2025 09/03/25 | For Sale | $338,000 | +14.6% | $177 / Sq Ft |
| 05/02/2022 05/02/22 | Sold | $295,000 | -7.5% | $106 / Sq Ft |
| 03/31/2022 03/31/22 | Pending | -- | -- | -- |
| 03/08/2022 03/08/22 | Price Changed | $318,999 | -20.2% | $115 / Sq Ft |
| 08/04/2021 08/04/21 | For Sale | $399,600 | +654.0% | $144 / Sq Ft |
| 08/03/2018 08/03/18 | Sold | $53,000 | -18.3% | $33 / Sq Ft |
| 07/25/2018 07/25/18 | Pending | -- | -- | -- |
| 07/02/2018 07/02/18 | For Sale | $64,900 | +116.3% | $41 / Sq Ft |
| 04/03/2017 04/03/17 | Sold | $30,000 | -23.1% | $19 / Sq Ft |
| 03/21/2017 03/21/17 | Pending | -- | -- | -- |
| 03/15/2017 03/15/17 | Price Changed | $39,000 | -8.2% | $24 / Sq Ft |
| 03/02/2017 03/02/17 | Price Changed | $42,500 | -1.2% | $27 / Sq Ft |
| 02/21/2017 02/21/17 | Price Changed | $43,000 | -3.4% | $27 / Sq Ft |
| 02/12/2017 02/12/17 | Price Changed | $44,500 | -1.1% | $28 / Sq Ft |
| 12/14/2016 12/14/16 | For Sale | $45,000 | +200.0% | $28 / Sq Ft |
| 11/04/2016 11/04/16 | Sold | $15,000 | -25.0% | $12 / Sq Ft |
| 10/26/2016 10/26/16 | Pending | -- | -- | -- |
| 10/19/2016 10/19/16 | Price Changed | $20,000 | -42.8% | $16 / Sq Ft |
| 08/29/2016 08/29/16 | For Sale | $34,990 | -- | $27 / Sq Ft |
| Year | Tax Paid | Tax Assessment Tax Assessment Total Assessment is a certain percentage of the fair market value that is determined by local assessors to be the total taxable value of land and additions on the property. | Land | Improvement |
|---|---|---|---|---|
| 2024 | $3,288 | $263,500 | $7,100 | $256,400 |
| 2023 | $3,288 | $270,400 | $7,100 | $263,300 |
| 2022 | $3,222 | $260,700 | $7,100 | $253,600 |
| 2021 | $5,060 | $215,700 | $7,100 | $208,600 |
| 2020 | $1,678 | $68,900 | $7,100 | $61,800 |
| 2019 | $3,297 | $51,100 | $3,800 | $47,300 |
| 2018 | $1,015 | $39,300 | $3,800 | $35,500 |
| 2017 | $2,093 | $37,500 | $3,800 | $33,700 |
| 2016 | $804 | $35,100 | $3,800 | $31,300 |
| 2014 | $819 | $37,900 | $3,800 | $34,100 |
| 2013 | $965 | $39,800 | $3,800 | $36,000 |
Seller's Agent in 2025
Kristin Glassburn
@properties
(317) 513-4251
1 in this area
218 Total Sales
J
Buyer's Agent in 2025
Jennifer Anderson
F.C. Tucker Company
(317) 748-3796
58 Total Sales
J
Seller's Agent in 2022
Joe Sullivan
Sullivan Realty Group, LLC
Seller's Agent in 2017
Sheila Brunette
Sheila Alvarez Brunette Realty
(317) 650-7155
41 Total Sales
P
Buyer's Agent in 2017
Pam Moore
J
Seller's Agent in 2016
Jennifer Marlow
Trueblood Real Estate
Source: MIBOR Broker Listing Cooperative®
MLS Number: 21802608
APN: 49-11-13-158-032.000-101
Disclaimer: Certain information contained herein is derived from information provided by parties other than Homes.com. All information provided is deemed reliable, but is not guaranteed to be accurate and should be independently verified.
![]() Based on information submitted to the MLS GRID. All data is obtained from various sources and may not have been verified by broker or MLS GRID. Supplied Open House Information is subject to change without notice. All information should be independently reviewed and verified for accuracy. Properties may or may not be listed by the office/agent presenting the information. Some IDX listings have been excluded from this website.
Based on information submitted to the MLS GRID. All data is obtained from various sources and may not have been verified by broker or MLS GRID. Supplied Open House Information is subject to change without notice. All information should be independently reviewed and verified for accuracy. Properties may or may not be listed by the office/agent presenting the information. Some IDX listings have been excluded from this website.