
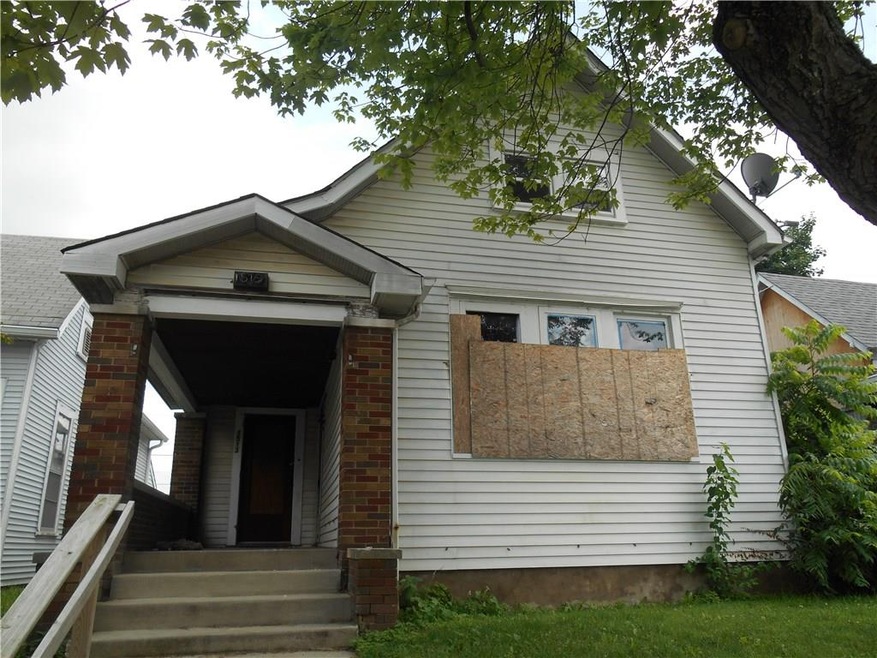
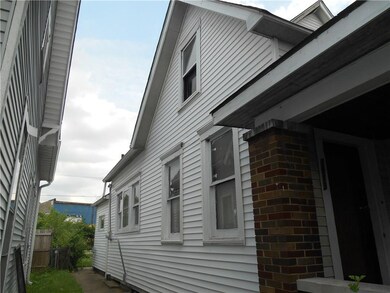
1513 S Talbott St Indianapolis, IN 46225
Old Southside Neighborhood
3
Beds
1
Bath
1,597
Sq Ft
4,530
Sq Ft Lot
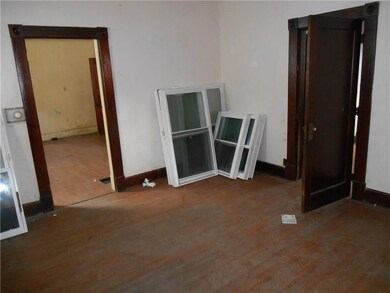
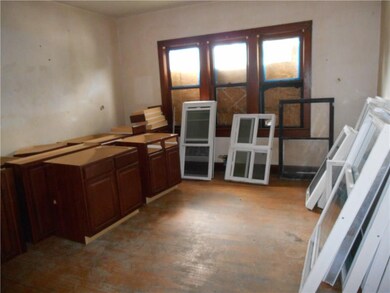
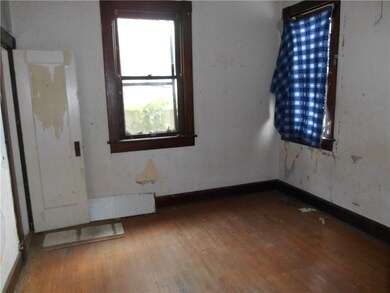
About This Home
As of May 20223 bedroom 1 bath home in near south-side rehab area. Hardwood floors, arched doorways, huge attic. owner has new windows, cabinets and tops in the house and included in the sale.
Last Agent to Sell the Property
Sullivan Realty Group, LLC License #RB14031738 Listed on: 07/02/2018
Last Buyer's Agent
Sullivan Realty Group, LLC License #RB14031738 Listed on: 07/02/2018
Home Details
Home Type
- Single Family
Est. Annual Taxes
- $186
Year Built
- Built in 1890
Home Design
- Block Foundation
- Aluminum Siding
Interior Spaces
- 1,597 Sq Ft Home
- 1-Story Property
- Unfinished Basement
Bedrooms and Bathrooms
- 3 Bedrooms
- 1 Full Bathroom
Utilities
- Heating System Uses Gas
- Natural Gas Connected
Additional Features
- Covered Patio or Porch
- 4,530 Sq Ft Lot
Community Details
- Fennemans Subdivision
Listing and Financial Details
- Assessor Parcel Number 491113158032000101
Ownership History
Date
Name
Owned For
Owner Type
Purchase Details
Listed on
Aug 4, 2021
Closed on
May 19, 2022
Sold by
Whitehead Charles T
Bought by
Hughes Tyler and Fiorillo Rebecca
Seller's Agent
Joe Sullivan
Sullivan Realty Group, LLC
Buyer's Agent
Kristin Glassburn
@properties
List Price
$399,600
Sold Price
$295,000
Premium/Discount to List
-$104,600
-26.18%
Current Estimated Value
Home Financials for this Owner
Home Financials are based on the most recent Mortgage that was taken out on this home.
Estimated Appreciation
$25,148
Avg. Annual Appreciation
2.43%
Original Mortgage
$286,150
Outstanding Balance
$272,613
Interest Rate
5.25%
Mortgage Type
New Conventional
Estimated Equity
$46,791
Purchase Details
Listed on
Aug 4, 2021
Closed on
May 2, 2022
Sold by
Whitehead Charles T
Bought by
Hughes Tyler and Fiorillo Rebecca
Seller's Agent
Joe Sullivan
Sullivan Realty Group, LLC
Buyer's Agent
Kristin Glassburn
@properties
List Price
$399,600
Sold Price
$295,000
Premium/Discount to List
-$104,600
-26.18%
Home Financials for this Owner
Home Financials are based on the most recent Mortgage that was taken out on this home.
Original Mortgage
$286,150
Outstanding Balance
$272,613
Interest Rate
5.25%
Mortgage Type
New Conventional
Estimated Equity
$46,791
Purchase Details
Listed on
Jul 2, 2018
Closed on
Aug 3, 2018
Sold by
Frazee Ronald and Frazee Barbara
Bought by
Whitehead Charles T
Seller's Agent
Joe Sullivan
Sullivan Realty Group, LLC
Buyer's Agent
Joe Sullivan
Sullivan Realty Group, LLC
List Price
$64,900
Sold Price
$53,000
Premium/Discount to List
-$11,900
-18.34%
Home Financials for this Owner
Home Financials are based on the most recent Mortgage that was taken out on this home.
Avg. Annual Appreciation
58.06%
Purchase Details
Listed on
Dec 14, 2016
Closed on
Apr 3, 2017
Sold by
Koonce Jon
Bought by
Frazee Ronald and Frazee Barbara
Seller's Agent
Sheila Brunette
Sheila Alvarez Brunette Realty
Buyer's Agent
Pam Moore
List Price
$45,000
Sold Price
$30,000
Premium/Discount to List
-$15,000
-33.33%
Home Financials for this Owner
Home Financials are based on the most recent Mortgage that was taken out on this home.
Avg. Annual Appreciation
53.40%
Purchase Details
Listed on
Aug 29, 2016
Closed on
Dec 8, 2016
Bought by
Koonce Jon
Seller's Agent
Jennifer Marlow
Trueblood Real Estate
Buyer's Agent
Joe Sullivan
Sullivan Realty Group, LLC
List Price
$34,990
Sold Price
$15,000
Premium/Discount to List
-$19,990
-57.13%
Home Financials for this Owner
Home Financials are based on the most recent Mortgage that was taken out on this home.
Avg. Annual Appreciation
442.27%
Purchase Details
Listed on
Aug 29, 2016
Closed on
Nov 4, 2016
Sold by
Noonan Ryan and Noonan Sylvia M
Bought by
Puma Cub Properties Llc
Seller's Agent
Jennifer Marlow
Trueblood Real Estate
Buyer's Agent
Joe Sullivan
Sullivan Realty Group, LLC
List Price
$34,990
Sold Price
$15,000
Premium/Discount to List
-$19,990
-57.13%
Similar Homes in Indianapolis, IN
Create a Home Valuation Report for This Property
The Home Valuation Report is an in-depth analysis detailing your home's value as well as a comparison with similar homes in the area
Home Values in the Area
Average Home Value in this Area
Purchase History
| Date | Type | Sale Price | Title Company |
|---|---|---|---|
| Warranty Deed | -- | Green Kassandra | |
| Warranty Deed | $295,000 | Green Kassandra | |
| Warranty Deed | $53,000 | Best Title Services | |
| Deed | $30,000 | -- | |
| Deed | $30,000 | Security Title Services | |
| Deed | $23,000 | -- | |
| Warranty Deed | -- | Best Title |
Source: Public Records
Mortgage History
| Date | Status | Loan Amount | Loan Type |
|---|---|---|---|
| Open | $286,150 | New Conventional | |
| Closed | $286,150 | New Conventional |
Source: Public Records
Property History
| Date | Event | Price | Change | Sq Ft Price |
|---|---|---|---|---|
| 05/02/2022 05/02/22 | Sold | $295,000 | -7.5% | $106 / Sq Ft |
| 03/31/2022 03/31/22 | Pending | -- | -- | -- |
| 03/08/2022 03/08/22 | Price Changed | $318,999 | -20.2% | $115 / Sq Ft |
| 08/04/2021 08/04/21 | For Sale | $399,600 | +654.0% | $144 / Sq Ft |
| 08/03/2018 08/03/18 | Sold | $53,000 | -18.3% | $33 / Sq Ft |
| 07/25/2018 07/25/18 | Pending | -- | -- | -- |
| 07/02/2018 07/02/18 | For Sale | $64,900 | +116.3% | $41 / Sq Ft |
| 04/03/2017 04/03/17 | Sold | $30,000 | -23.1% | $19 / Sq Ft |
| 03/21/2017 03/21/17 | Pending | -- | -- | -- |
| 03/15/2017 03/15/17 | Price Changed | $39,000 | -8.2% | $24 / Sq Ft |
| 03/02/2017 03/02/17 | Price Changed | $42,500 | -1.2% | $27 / Sq Ft |
| 02/21/2017 02/21/17 | Price Changed | $43,000 | -3.4% | $27 / Sq Ft |
| 02/12/2017 02/12/17 | Price Changed | $44,500 | -1.1% | $28 / Sq Ft |
| 12/14/2016 12/14/16 | For Sale | $45,000 | +200.0% | $28 / Sq Ft |
| 11/04/2016 11/04/16 | Sold | $15,000 | -25.0% | $12 / Sq Ft |
| 10/26/2016 10/26/16 | Pending | -- | -- | -- |
| 10/19/2016 10/19/16 | Price Changed | $20,000 | -42.8% | $16 / Sq Ft |
| 08/29/2016 08/29/16 | For Sale | $34,990 | -- | $27 / Sq Ft |
Source: MIBOR Broker Listing Cooperative®
Tax History Compared to Growth
Tax History
| Year | Tax Paid | Tax Assessment Tax Assessment Total Assessment is a certain percentage of the fair market value that is determined by local assessors to be the total taxable value of land and additions on the property. | Land | Improvement |
|---|---|---|---|---|
| 2024 | $3,288 | $263,500 | $7,100 | $256,400 |
| 2023 | $3,288 | $270,400 | $7,100 | $263,300 |
| 2022 | $3,222 | $260,700 | $7,100 | $253,600 |
| 2021 | $5,060 | $215,700 | $7,100 | $208,600 |
| 2020 | $1,678 | $68,900 | $7,100 | $61,800 |
| 2019 | $3,297 | $51,100 | $3,800 | $47,300 |
| 2018 | $1,015 | $39,300 | $3,800 | $35,500 |
| 2017 | $2,093 | $37,500 | $3,800 | $33,700 |
| 2016 | $804 | $35,100 | $3,800 | $31,300 |
| 2014 | $819 | $37,900 | $3,800 | $34,100 |
| 2013 | $965 | $39,800 | $3,800 | $36,000 |
Source: Public Records
Agents Affiliated with this Home
-
J
Seller's Agent in 2022
Joe Sullivan
Sullivan Realty Group, LLC
-
K
Buyer's Agent in 2022
Kristin Glassburn
@properties
-
Sheila Brunette
Seller's Agent in 2017
Sheila Brunette
Sheila Alvarez Brunette Realty
(317) 650-7155
41 Total Sales
-
P
Buyer's Agent in 2017
Pam Moore
-
J
Seller's Agent in 2016
Jennifer Marlow
Trueblood Real Estate
Map
Source: MIBOR Broker Listing Cooperative®
MLS Number: MBR21578167
APN: 49-11-13-158-032.000-101
Disclaimer: Certain information contained herein is derived from information provided by parties other than Homes.com. All information provided is deemed reliable, but is not guaranteed to be accurate and should be independently verified.
![]() Based on information submitted to the MLS GRID. All data is obtained from various sources and may not have been verified by broker or MLS GRID. Supplied Open House Information is subject to change without notice. All information should be independently reviewed and verified for accuracy. Properties may or may not be listed by the office/agent presenting the information. Some IDX listings have been excluded from this website.
Based on information submitted to the MLS GRID. All data is obtained from various sources and may not have been verified by broker or MLS GRID. Supplied Open House Information is subject to change without notice. All information should be independently reviewed and verified for accuracy. Properties may or may not be listed by the office/agent presenting the information. Some IDX listings have been excluded from this website.
Nearby Homes
- 1401 S Talbott St
- 1626 S Delaware St
- 49 E Arizona St
- 1433 Charles St
- 1459 S Meridian St
- 1661 S Talbott St
- 1666 S Talbott St
- 1425 Kennington St
- 1667 Union St
- 1542 S Alabama St
- 1666 Union St
- 1715 Union St
- 1722 S Delaware St
- 1315 Union St
- 1501 S Alabama St
- 1306 S Talbott St
- 1734 S Talbott St
- 329 Parkway Ave
- 326 Parkway Ave
- 359 Terrace Ave